Understanding Indicators : Cryptocurrency Technical Analysis for Beginners!
Trends

The way that you understand trends is just as important as the Technical Indicators TI that help you approach trading with a good degree of certainty. There are two major trends that you should be very familiar with. Bullish & Bearish trends.
Bullish trends indicate a continuous increase in price over time. Possibly set new all time highs ATH in the process.
Bearish trends indicate a continuous decrease in price over time. Possibly set a new low as a reversal of the Bullish trend.
Snowball Effect
One of the main reasons why most investors make little to no money from their investment is due to uncertainty. Unfortunately investors coming into the cryptocurrency space need to have reassurance that their investment is going to be profitable. This leads them to buy in, when the price is in a Bullish trend. The snowball effect kicks in and we have a repeating pattern of events :
- More and more people buy in a bullish trend, having strong reassurance for their investment.
- The price goes up.
- Price reaches ATH.
- Trend reversal.
- More and more people sell and a bearish trend is formed.
- Lost faith in the original investment is all gone.
Now depending on where they have positioned themselves with this buy or sell -they can either be very profitable or loose money in the process. You don't have to look far to see that if you were to get in at the beginning of a bullish trend, you could increase your holding or make profit. The same can be said if you were to get in, at the end of a bearish trend. Of course you wouldn't know when the trends are going to start...
What if I told you that there are tools that eliminate the gambling aspect of investing, let you know when to position yourself and see the trend reversals before they even happen?
Indicators
We will be exploring indicators that will help you rid yourself of emotional and financial stress. Hopefully better understand trends and more often than not, succeed in your long / sort term investment.
RSI (Relative Strength Index)
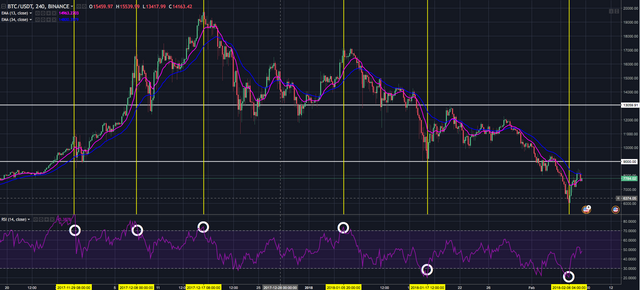
The RSI will help you understand good points to buy or sell. There are two horizontal dashed lines indicating the band in which the price is moving. The upper line band 70 will act as a resistance line. A breached line would indicate a good place to sell since the coin/asset is overbought and is most likely going into a trend reversal. The RSI is also going to give a lower line band 30 which acts as support. A lower band breach will result in a good buying opportunity. The asset is clearly oversold and a trend reversal is imminent. It needs to be noted that optimal results will arise by looking at the 30m, 1h and 4h charts.

MACD (Moving Average Convergence Divergence)
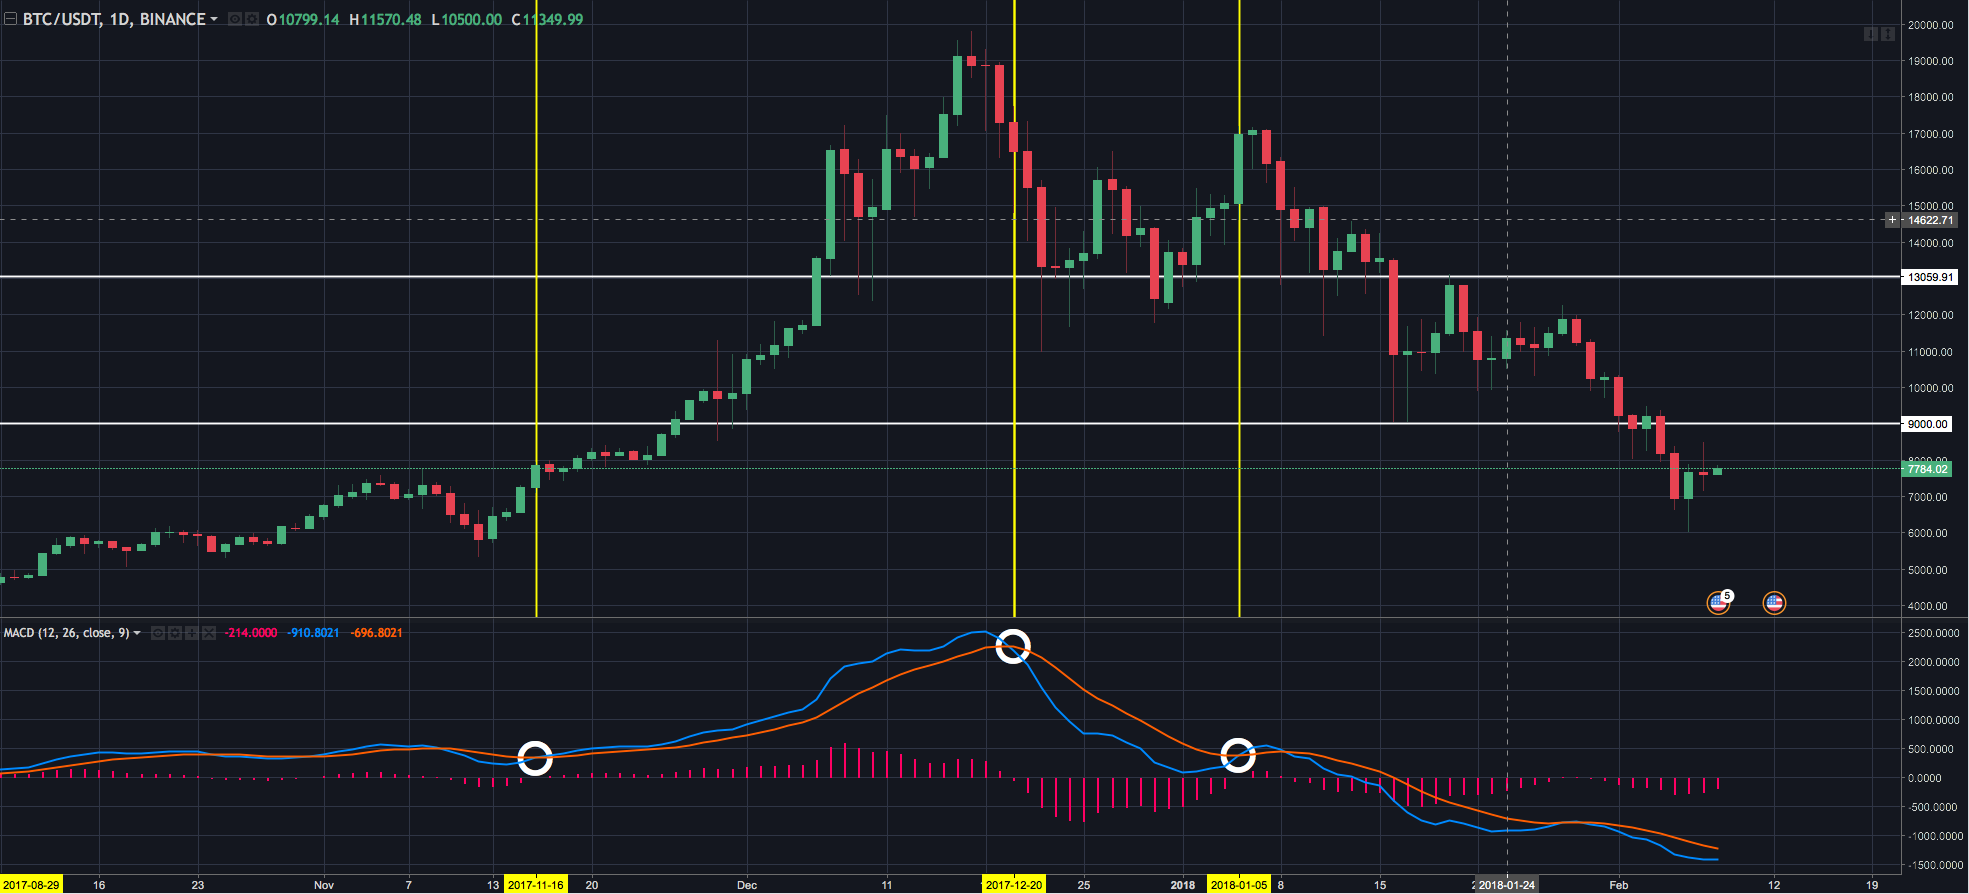
The MACD indicator will help you better understand trend reversals. Moving from Bullish to Bearish and vice versa.

Conclusion
Use the indicators to your advantage. Erase any concepts that you might have that you can become rich over night. The moment you realise that patience is the key to win the game, it will automatically bring you ahead of the competition. For every winner in this game there is a looser, it's up to you to decide which role you want to play.
Let me know what you think in the comments down below!
I Buy when bitcoin is down Sell when bitcoin is up, The trick is finding the top to sell at. Indicators do help with that decision . Thanks
Happy to help :)