Steem Fell 2% For The Week, But Formed An Interesting Doji Sign
Steem had a volatile week and in the beginning of the week it went all the way down to 2,60 before it managed to bounce back up again and close the week at 3,80. Here is the weekly chart:

Comment: The weekly action was very similar to Bitcoin, it did form at nice hammer or a doji sign if you will. This could indicate that we have formed a bottom here but the potential negative thing here is that the stochastics is at 40 now so there is some downside potential left.
Now, lets end this weekly analysis with the daily area line chart:
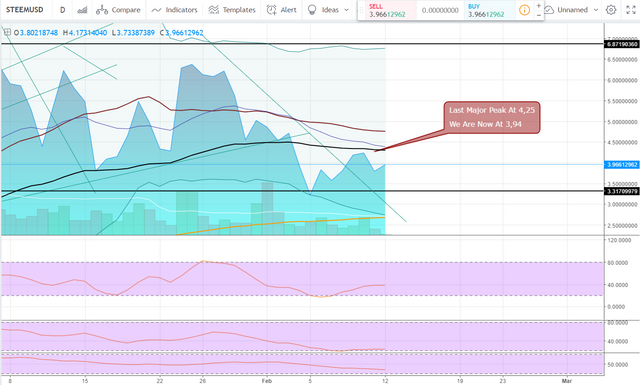
Comment: In this chart we can see that the last major peak for Steem was 4,25 so this is the next target for Steem to the upside and we are currently at 3,94 so we are not that far away. If we will get a daily close above this level, I do believe that we will continue to go higher from here.
Happy Steeming!
Also interesting is that volume has been at an all-week low this past day since the dip. I'm optimistic that means we've reached a bit of a bottom and we could see a bounce back, especially when coupled with the technicals
I'm seeing over $4 on steem.supply. I'm not sure where he takes the price from but it's usually close to blocktrades. It's all better than $1 :)
Yup! Anything above 1-3 for Steem is good for me at the moment. I want SBD to jump
You and me both!