SBD Might Trend Down, Compared With STEEM
Since I added the SBD to STEEM chart on steem.supply, I find myself looking more and more at those numbers. And based on what I see, I tend to see a potential depreciation of SBD against STEEM.

The average price is the one that is more useful here, but only because of the two open and close lines.
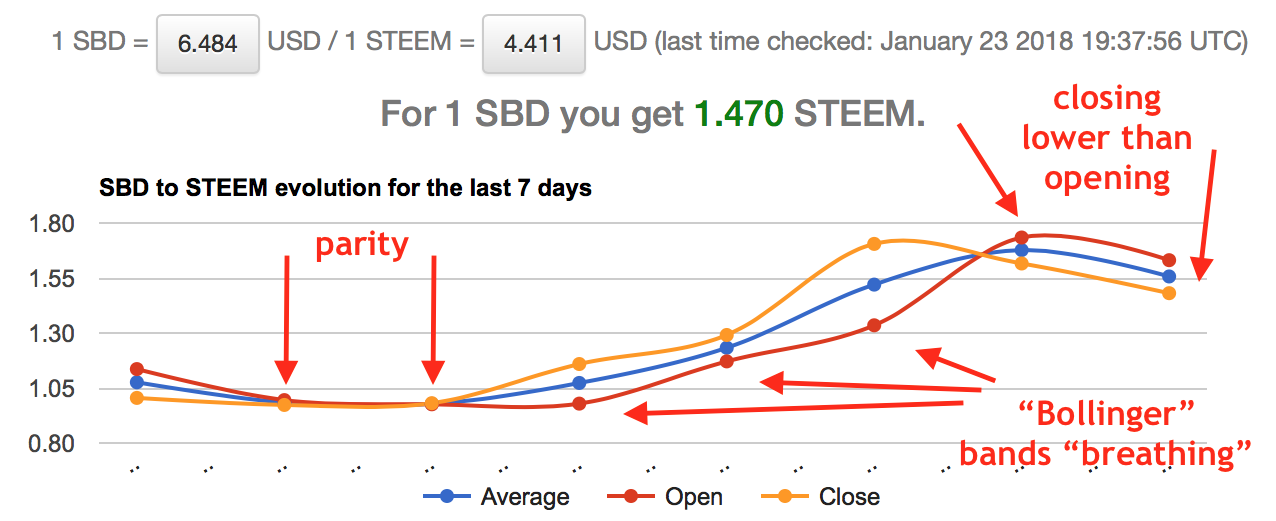
In the graph pictured above, we start with 2 days at perfect parity, followed by three days of "Bollinger" bands inflating. I know, these are not really Bollinger bands, but they certainly look like them. The bigger the gap between those lines, the stronger SBD is performing against STEEM. These "pump" days are, in a normal context, followed by corrective days. What "breathes in", must "breathes out".
Now, as long as the orange line is on top, it means SBD is appreciating, or trending up. If the red line is on top, it means SBD is depreciating, or trending down.
So, based on the last two days when it closed lower than it opened, after 3 days if "breathing in", seems like SBD will still trend down. Of course, it's just speculation, only the market knows where it will head.
Thanks again to those who suggested this feature and yes, I'm thinking of a way to add more data points (more days).
Steem on!
I'm a serial entrepreneur, blogger and ultrarunner. You can find me mainly on my blog at Dragos Roua where I write about productivity, business, relationships and running. Here on Steemit you may stay updated by following me @dragosroua.

Wanna know when you're getting paid?

|
I know the feeling. That's why I created steem.supply, an easy to use and accurate tool for calculating your Steemit rewards |
Thanks for sharing and loving the new chart!
The lines are definitely a needed upgrade.
If you drew these as candles after the two days at parity you'd have three green candles, with the third being the largest (potentially a blow-off top of sorts). Now we get two red candles. based on the limited data set it certainly looks like support at parity or 1.00 and resistance at the 1.65 level. Not sure what the historical data is though as I haven't been around that long, and haven't taken the time to look (being fairly "poor" with little to trade anyway). I'm excited that you're investigating expanding the data points, great stuff!
Maybe a small tutorial on how to interpret that graph would be useful because I still scratch my head when I look at it ( I'm sorry if you posted it already and I didn't catch it)
well, there isn't any, really, you just look at the lines: "average" is the average price computed from highest and lowest within a day, "open" is the price at the beginning of the day (0:00 UTC) and "close" is the price at the end of the day (23:59 UTC, or current time for the current day).
Based on that, you try to make your own ideas about what's going on :)
Each data point represents SBD price/STEEM price?
yes
It will make this less painful.
Witness Discussion – SBD price and reverse peg
It's a great addition to one of my favorite websites. Thank you!
About SBD, I hope it goes up and up, higher than high!
Thanks for the nice words, appreciated :)
Yup probably seems the time to convert some of my SBD to Steem and power up more while the ratio is good.
I may not be understanding correctly, are you saying SBd is going to fall and Steem is going to rise
I'm saying that it might trend down, as the title says :) At least that's what I see in that chart, but obviously, I may be very wrong.
I had been using steem.supply to check the ratios before you added this tool. This historical information is very useful to know when to trade in the market place. Adding more days to the graph like you said would be cool. I am not sure how hard it would be to code but it would be awesome to have this info by the hour as well. Maybe have an option to view by the day or by the hour increment.
sbd doesn't seem to be doing as good lately but that could change tomorrow.
Yes, I noticed this addition on steem.supply, but wasn’ sure how to read this data. Thanks for this explanation, now it makes more sense to me.