Steem Price Analysis STEEM/BTC Bullish Signs for Steem
After a slight pullback, it looks like support has held for Steem and we are seeing price move to the upside in the monthly channel.
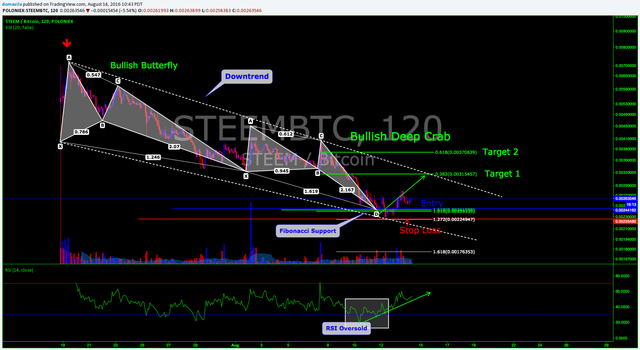
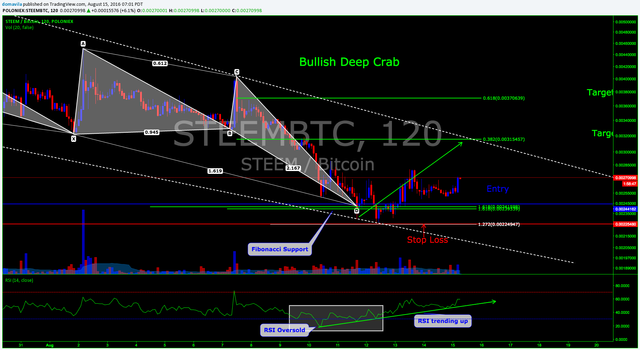
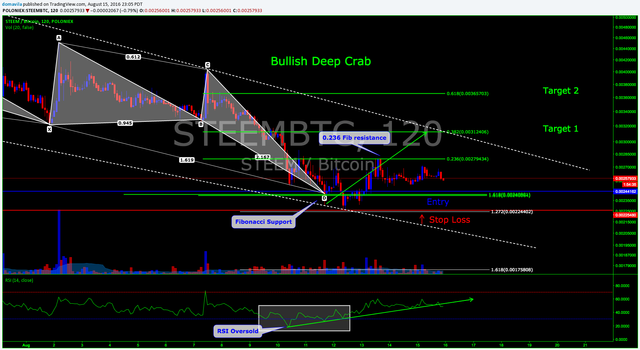
This is my continued analysis on the STEEM/BTC pair on the 120 minute time frame, along with multi time frame analysis to gain some deeper insight into the STEEM/BTC pair.
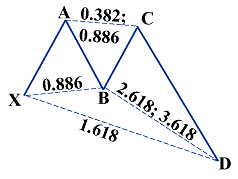
After reaching all time lows on the poloniex exchange a few days ago support has held and is rebounding upwards in the channel. Steem has been in a steady downtrend for nearly a month and it looks like the bears have finally been exhausted and are no longer pushing price lower. In my previous blog, STEEMBTC A Butterfly Dies.. a Deep Crab Emerges. Reversal Time for STEEM?? I mentioned a Deep Crab has formed which is a nice bullish signal. The Deep Crab, which completes at the 1.618 fibonacci extension, is a nice reversal sign and we often see price change direction once this harmonic pattern completes.
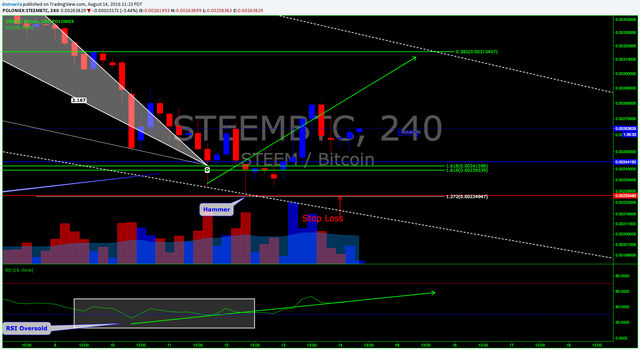
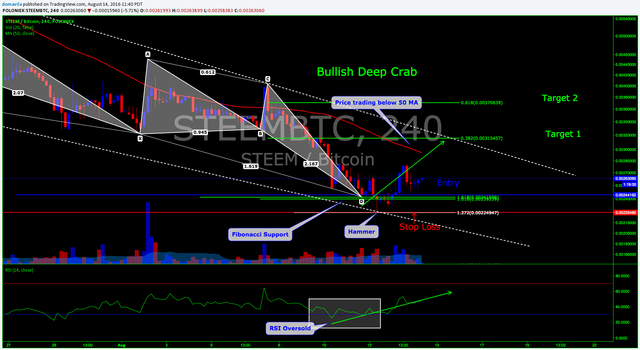
When doing multi time frame analysis I opened the 240 min chart and I found another bullish signal. What I found was the infamous hammer!
View Image
Those who trade Japanese candlesticks know this is a bullish reversal signal and countertrend traders love when they see this candlestick form.
Coincidentally, this hammer formed right at bottom of the downtrend channel and then rebounded which is another bullish signal.
The bulls aren't out of the woods yet.
Price has been in a steady down channel for almost a month which is bearish long term. The saying "The trend is your friend" has been the war cry of the bears of late, and with price trading under the 50 MA on the 240 min, the larger trend still appears down.
RSI
RSI has been trending upwards since it hit oversold territory a few days ago. RSI currently sits at 53.4 and is now above the 50 mark which is quite bullish.
Conclusion
It looks like my long position on the Deep Crab is turning out quite nicely. Support has held and we saw a nice rebound off of support at the bottom of the channel. This combined with the bullish hammer on the 240 appear as if the bulls are finally gaining some control. This case shows the power of Harmonic Trading. Please watch my live trade here for up to date commentary and price and remember to hit the play button on the chart.
Please follow the comments section for updates and continued analysis of the STEEM/BTC pair.
Disclaimer
This is for educational purposes only and is not financial advice.
Harmonic Trading was invented by Scott Carney.
Very interesting! I actually just bought a few STEEM some minutes ago, thinking it was ready for upward movement, but without anything as fancy as your analysis to back it up. Now i feel even more confident i will make a few satoshis at some point. :)
Right on @tobythecat!! I hope my analysis helped. I will be updating this pair in the comments section below as my trade plays out. Please stay tuned! Also, follow my trade live here to watch it play out in real time.
So if I understand it right, is this the point where everything might start going up?
Yes, question is how fast, and for how long.
@iosif This is what my technical-analysis is showing me but remember in trading nothing is for certain!!
Thanks! True, this is certainly more than a blind guess though :)
I agree.
I have no idea what any of this means...but I so desperately want to understand. Anyone want to volunteer to tutor me on Steem Economics?
@caleballen Trading and Technical-Analysis take a lot of work and effort. Discipline and trading psychology are very important aspects of trading as well. If you have any questions feel free to ask. I provide lots of information in the links provided in my analysis, check out my other charts too! Take it easy.
I appreciate the offer. I've been clicking through the links, but I'm out my depth here. I have so many questions...but I don't know what they are. haha I don't know what to ask.
So, the deep crab is a prediction model right? A mathematical projection that predicts when the stock will hit a low point and then rise on the same plane. Is that right so far?
@caleballen It is a harmonic pattern based on a specific set of fibonacci ratios. Once it completes and support holds in this area it often reverses direction. Lets see if this one plays out. Harmonic Trading seems advanced at first but once you learn the patterns it gets easier.
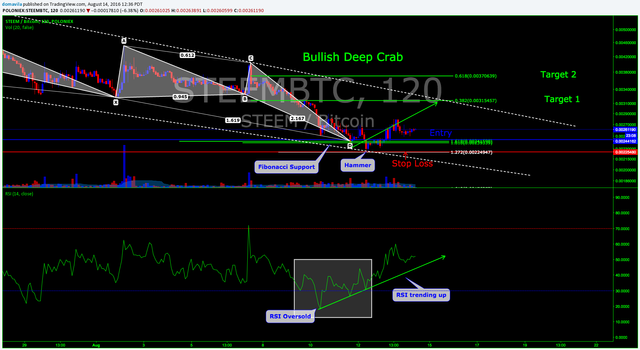
UPDATE
Steem support is holding quite nicely. Price has moved up in the past few hours and RSI has been trending upwards and sits at 59.9 as of this update.
View Image
We are running into some fib resistance at the 0.236 retracement. Once Steem breaks this resistance the 0.382 fibonacci retracement will be our next target.
View Image
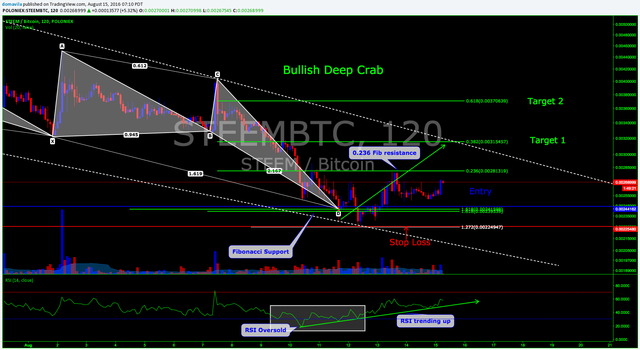
UPDATE 2
Price has been moving sideways and appears to be consolidating in this range. Steem buyers need to break the resistance at the 0.236 fib (0.0028 BTC) if they want to see more upside.
Downside targets still remain near the fib support at the 1.618 extensions (0.0024 BTC) and a further possible downside target of 0.00224 BTC at the 1.272 fib projection. If sellers push price to this level it would retest previous lows and could act as a nice support zone. This area looks to be decisive in this battle of the "Bulls Vs. The Bears".
View Image
Once the market chooses a direction and we see some action I will continue my analysis.
UPDATE 3
Please follow my continued analysis on this pair here, Steem Price Analysis STEEM/BTC Bullish Signs for Steem.