Technical Analysis Tutorial, ETC, lol no I mean Ethereum Classic... Is that joke old yet?
Someone requested that I look at ETC, so let's dive into the charts!
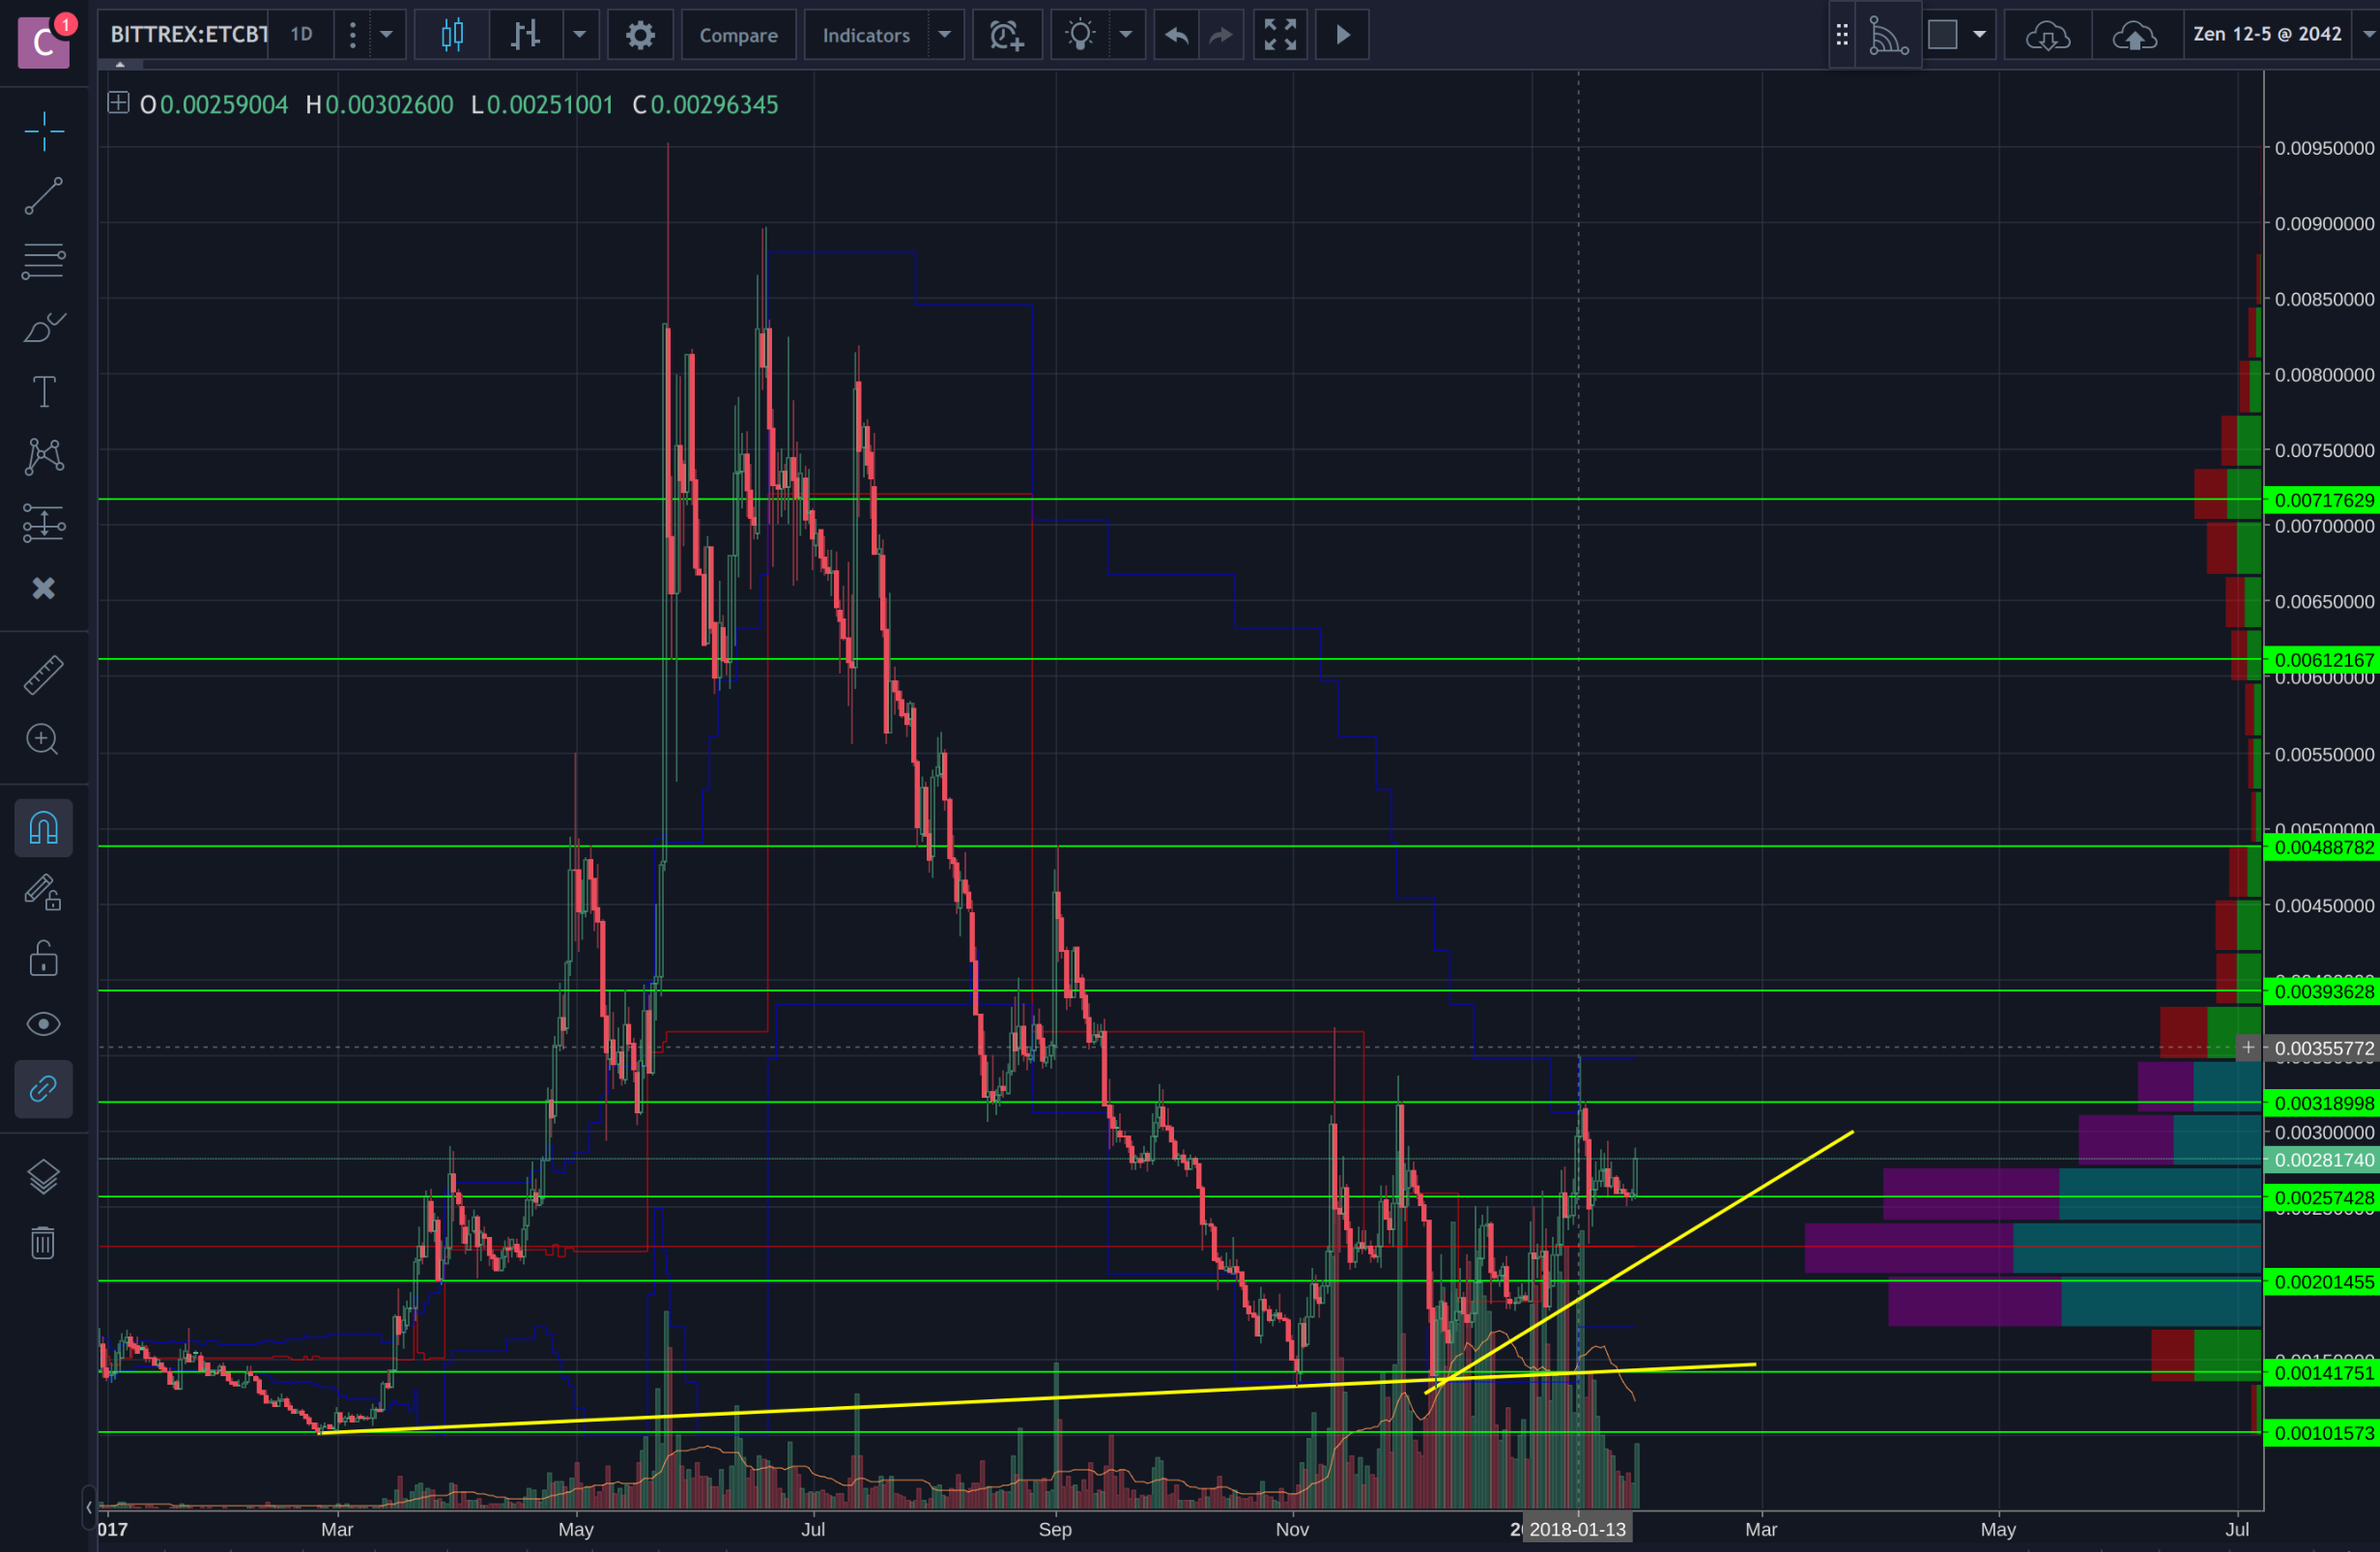
Here is a magnificent view of ETC/BTC for ~1 and 1/3 years
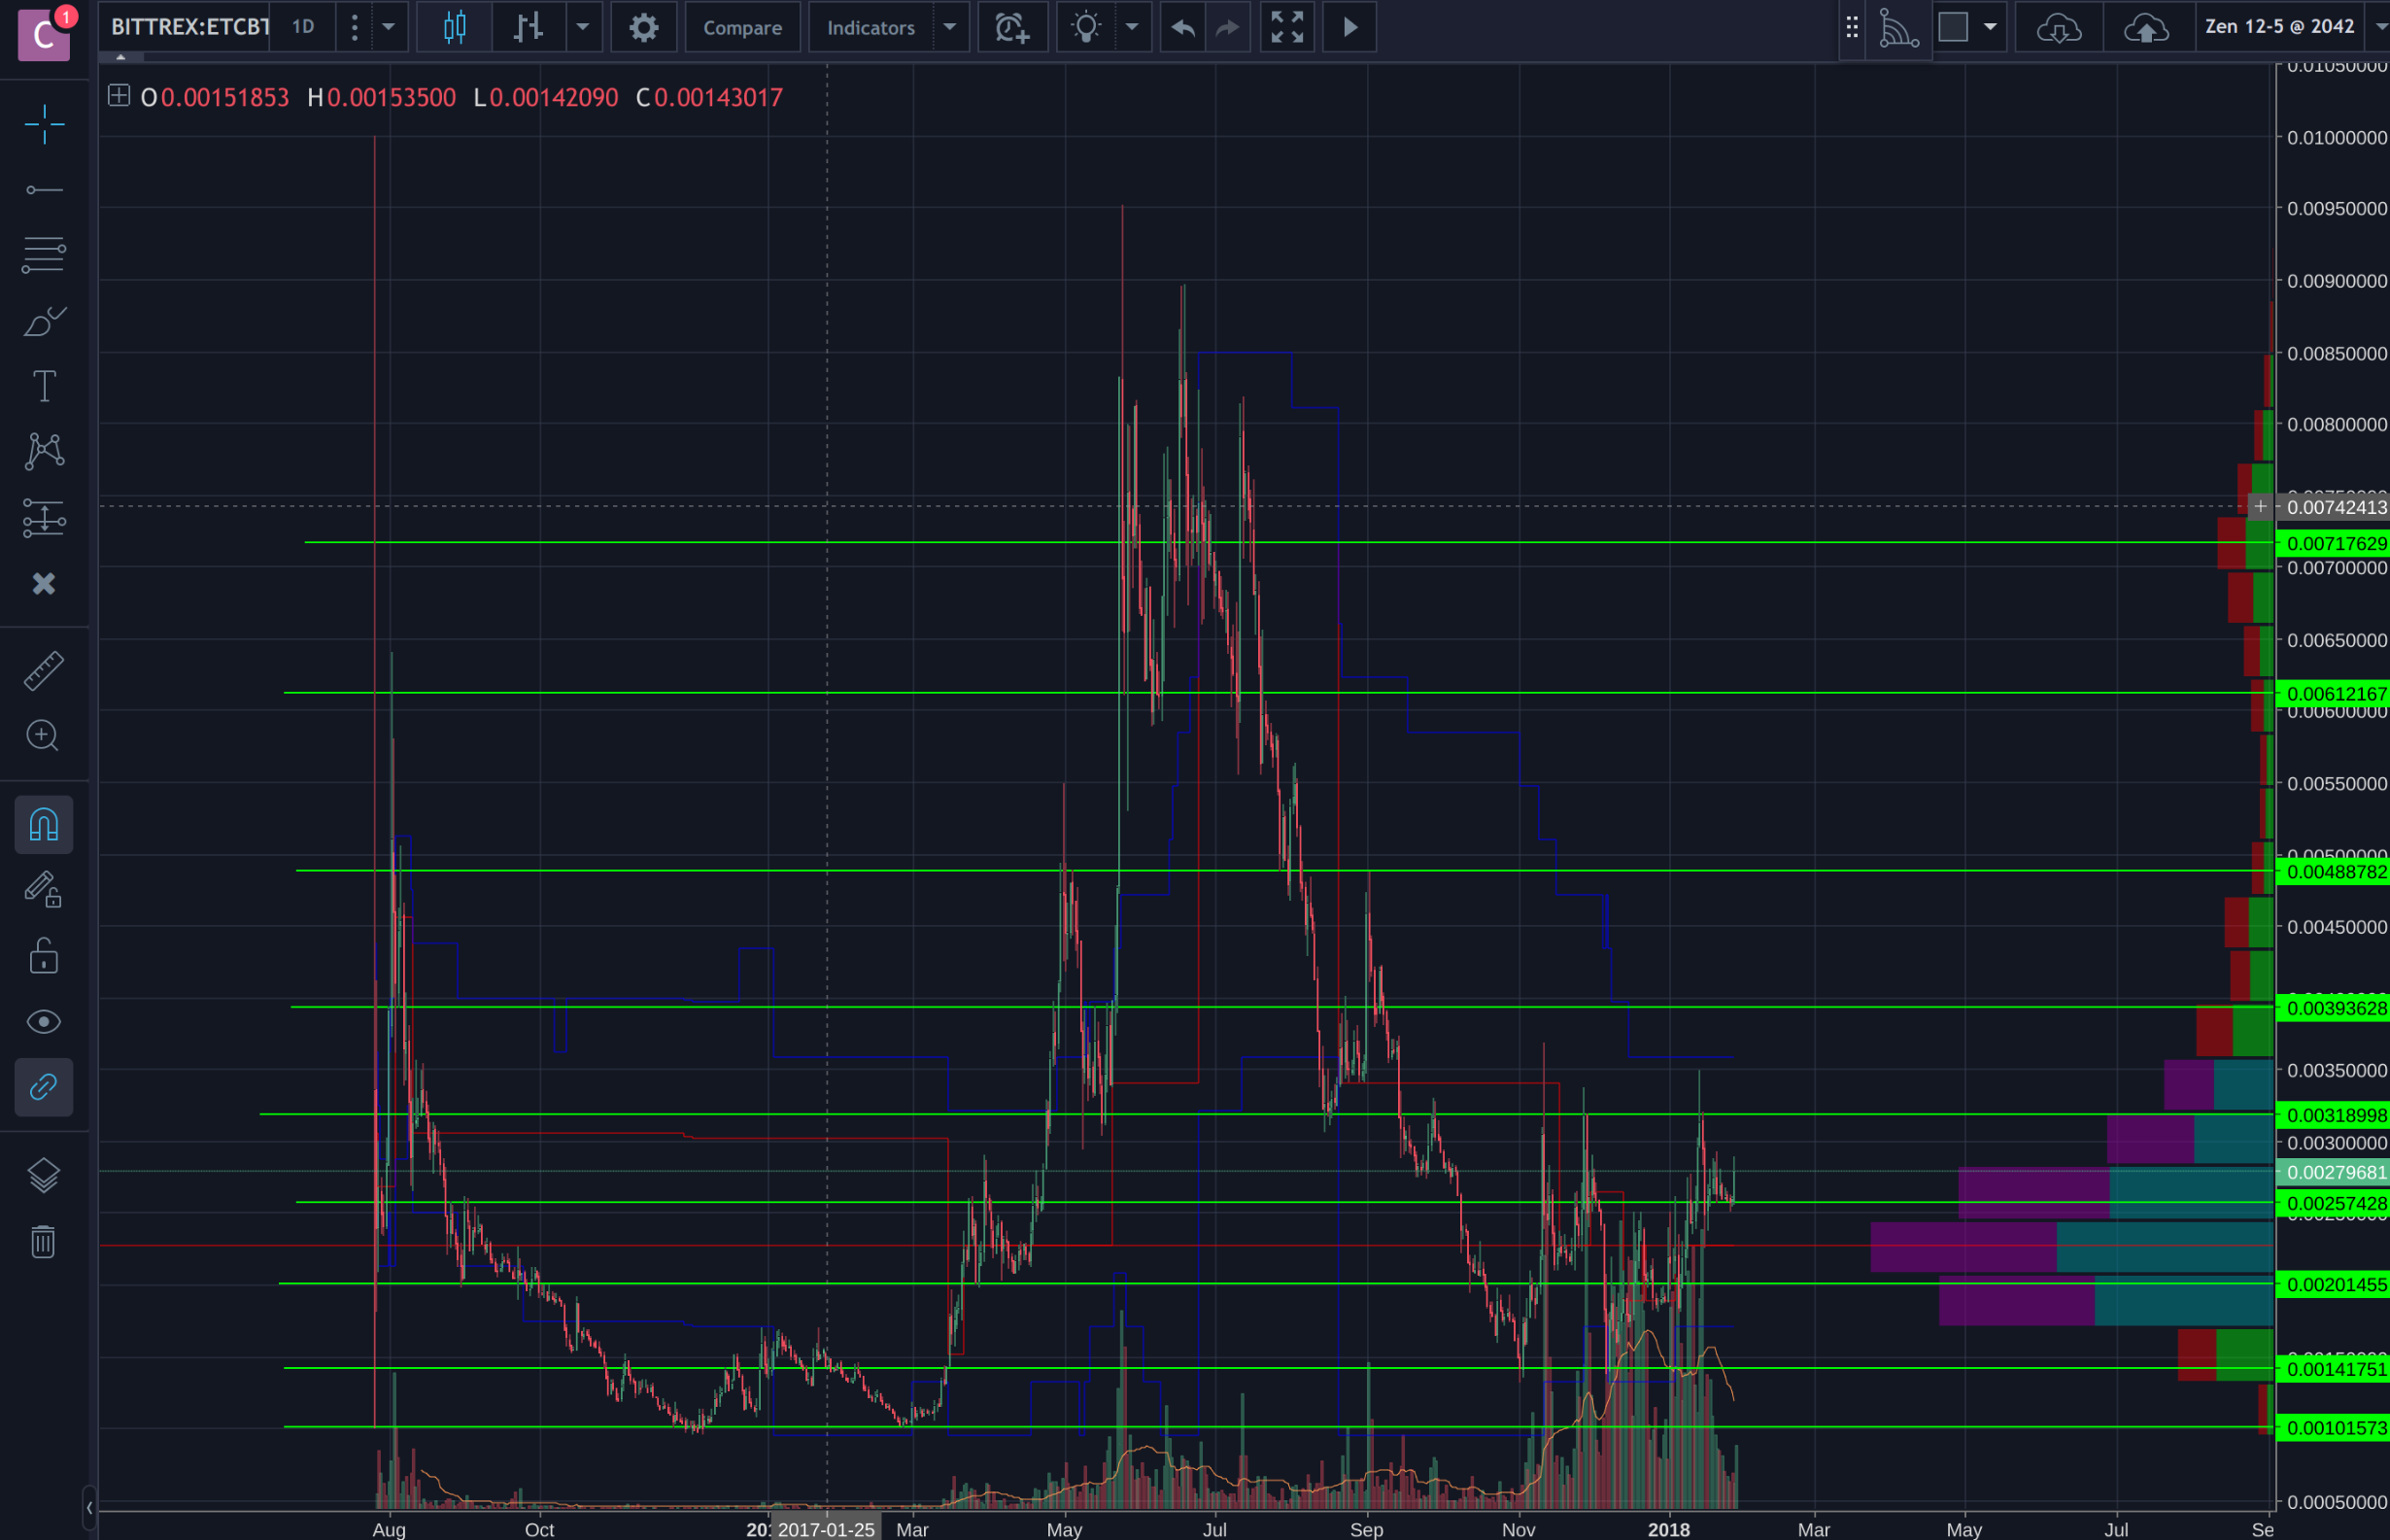
I like to start big to try to get the big picture. Some days I do my analysis differently to try to gain new perspectives on what is happening. Today I placed some support levels. These can easily be eyeballed.
Our Visible Range is showing that the majority of trading was happening at the lower ranges of prices: 0.0035-0.001 BTC.
A high price for no support!! That's how you get weak hands into the market: superficialities. And then strong hands walk away with the money. If no one sold at the top the price might have just kept rising until someone was willing to take profits or the market stabilized and the price stayed the same.
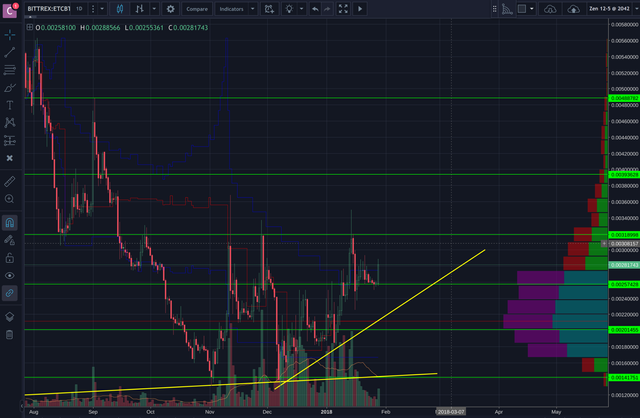
Zooming in a bit to the 11 month view and this big mountain:
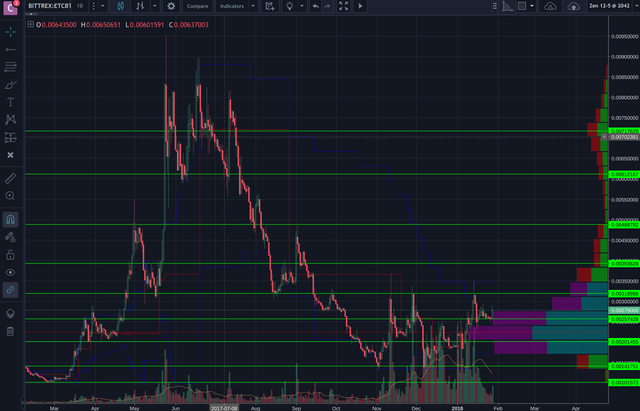
Even without around 6-7 months of history, 70% of the trading volume is still in that price range. The recent dip in price you can see from Oct 2017 to present carried a huge amount of volume. That price range seems to be favored even still. Maybe those hands are still meddling!
Im cutting off the past 4 months and just looking at the unprecedented price rise and fall:
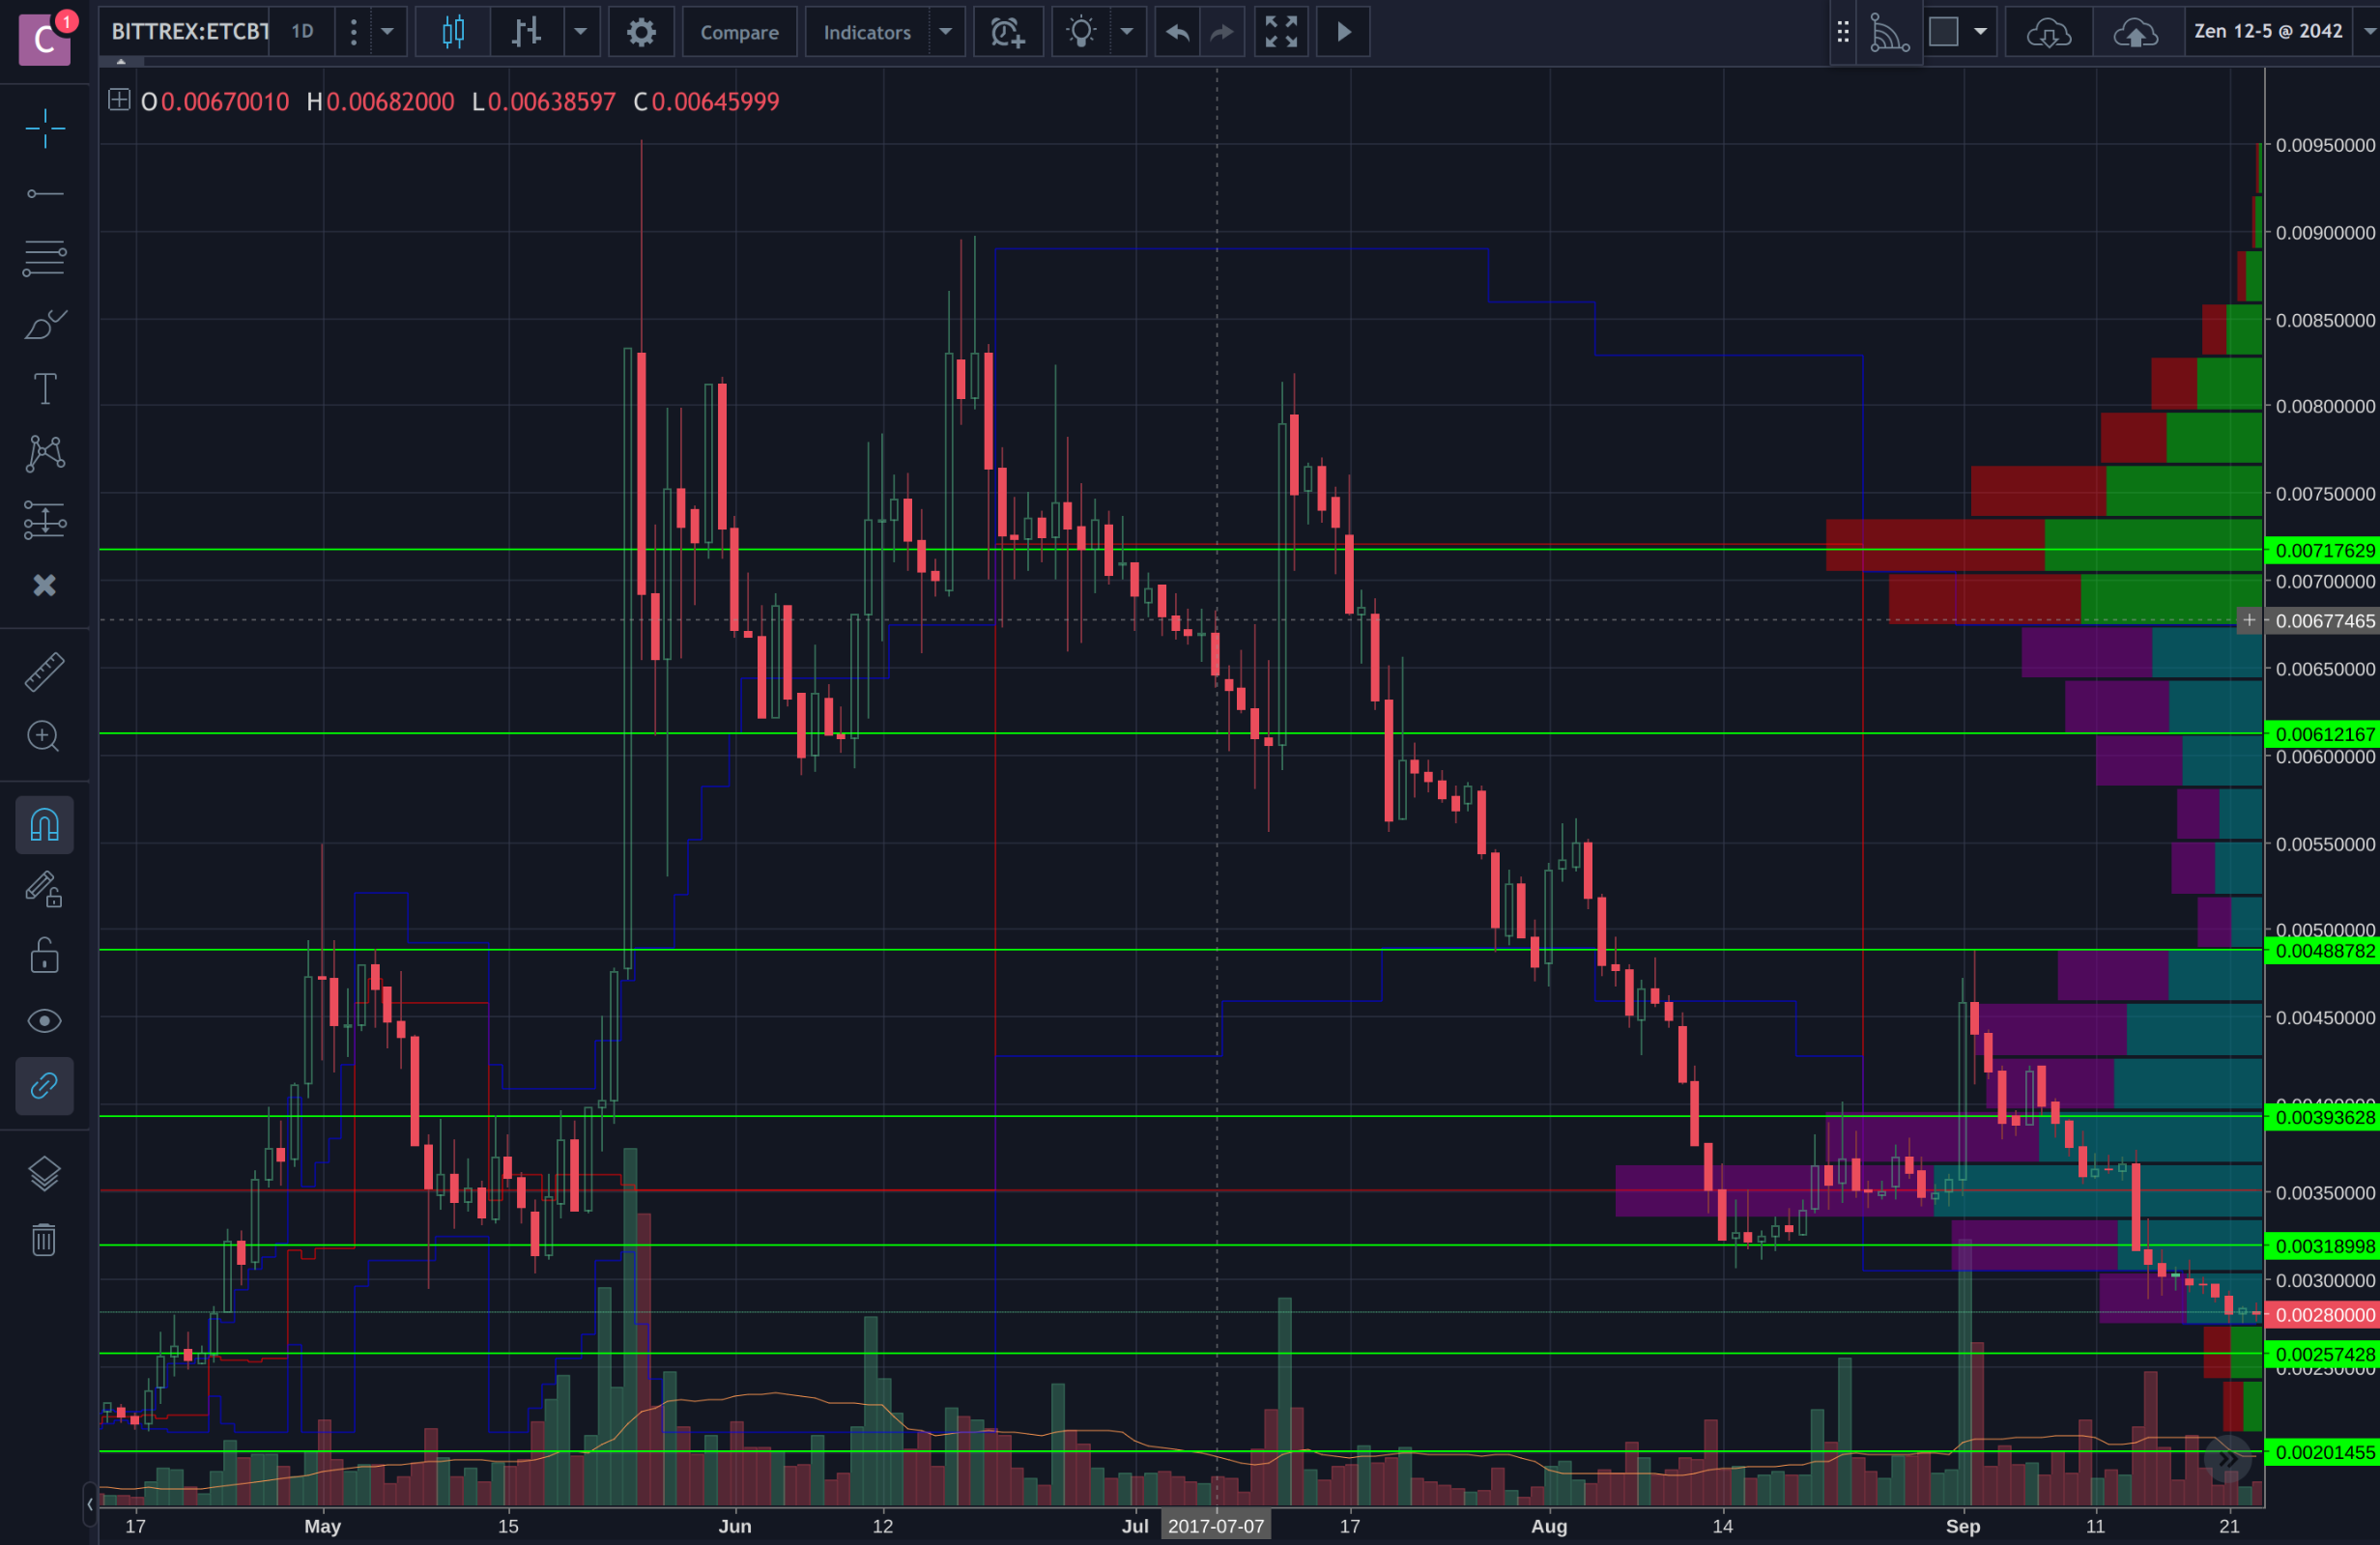
We can see the support bases are symmetrically respected. Volume seemed to decrease until about August when it seems people were finding themselves in support of the price ranges. Momentum slowed. We can use the history to teach us about sentiment.
Below we can the around the last push to the top, where the price was unsustainable, the local bottom trends were down. Volume overall was decreasing, and the point of control was around 0.0035 BTC
The longer term bottom trends, i.e. the lowest support base respected, does seem to be rising. Everything else in between is where the money is made, or handed over rather.
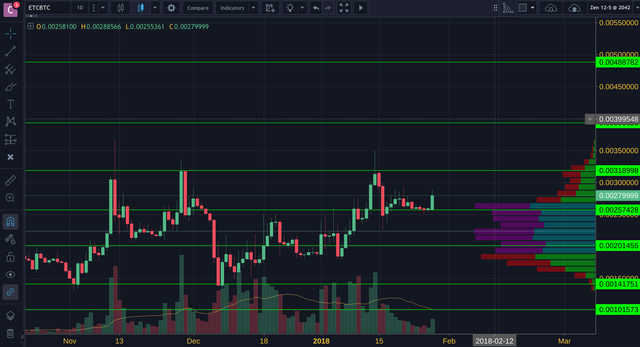
November to Present, the price has been oscillating around the current POC. The left over energy and momentum had to dissipate, and the ensuing oscillations were a great opportunity to place orders above and below the POC.
It seems the price now is respecting the base around 0.00257428 BTC. Watch there to see what will happen next.
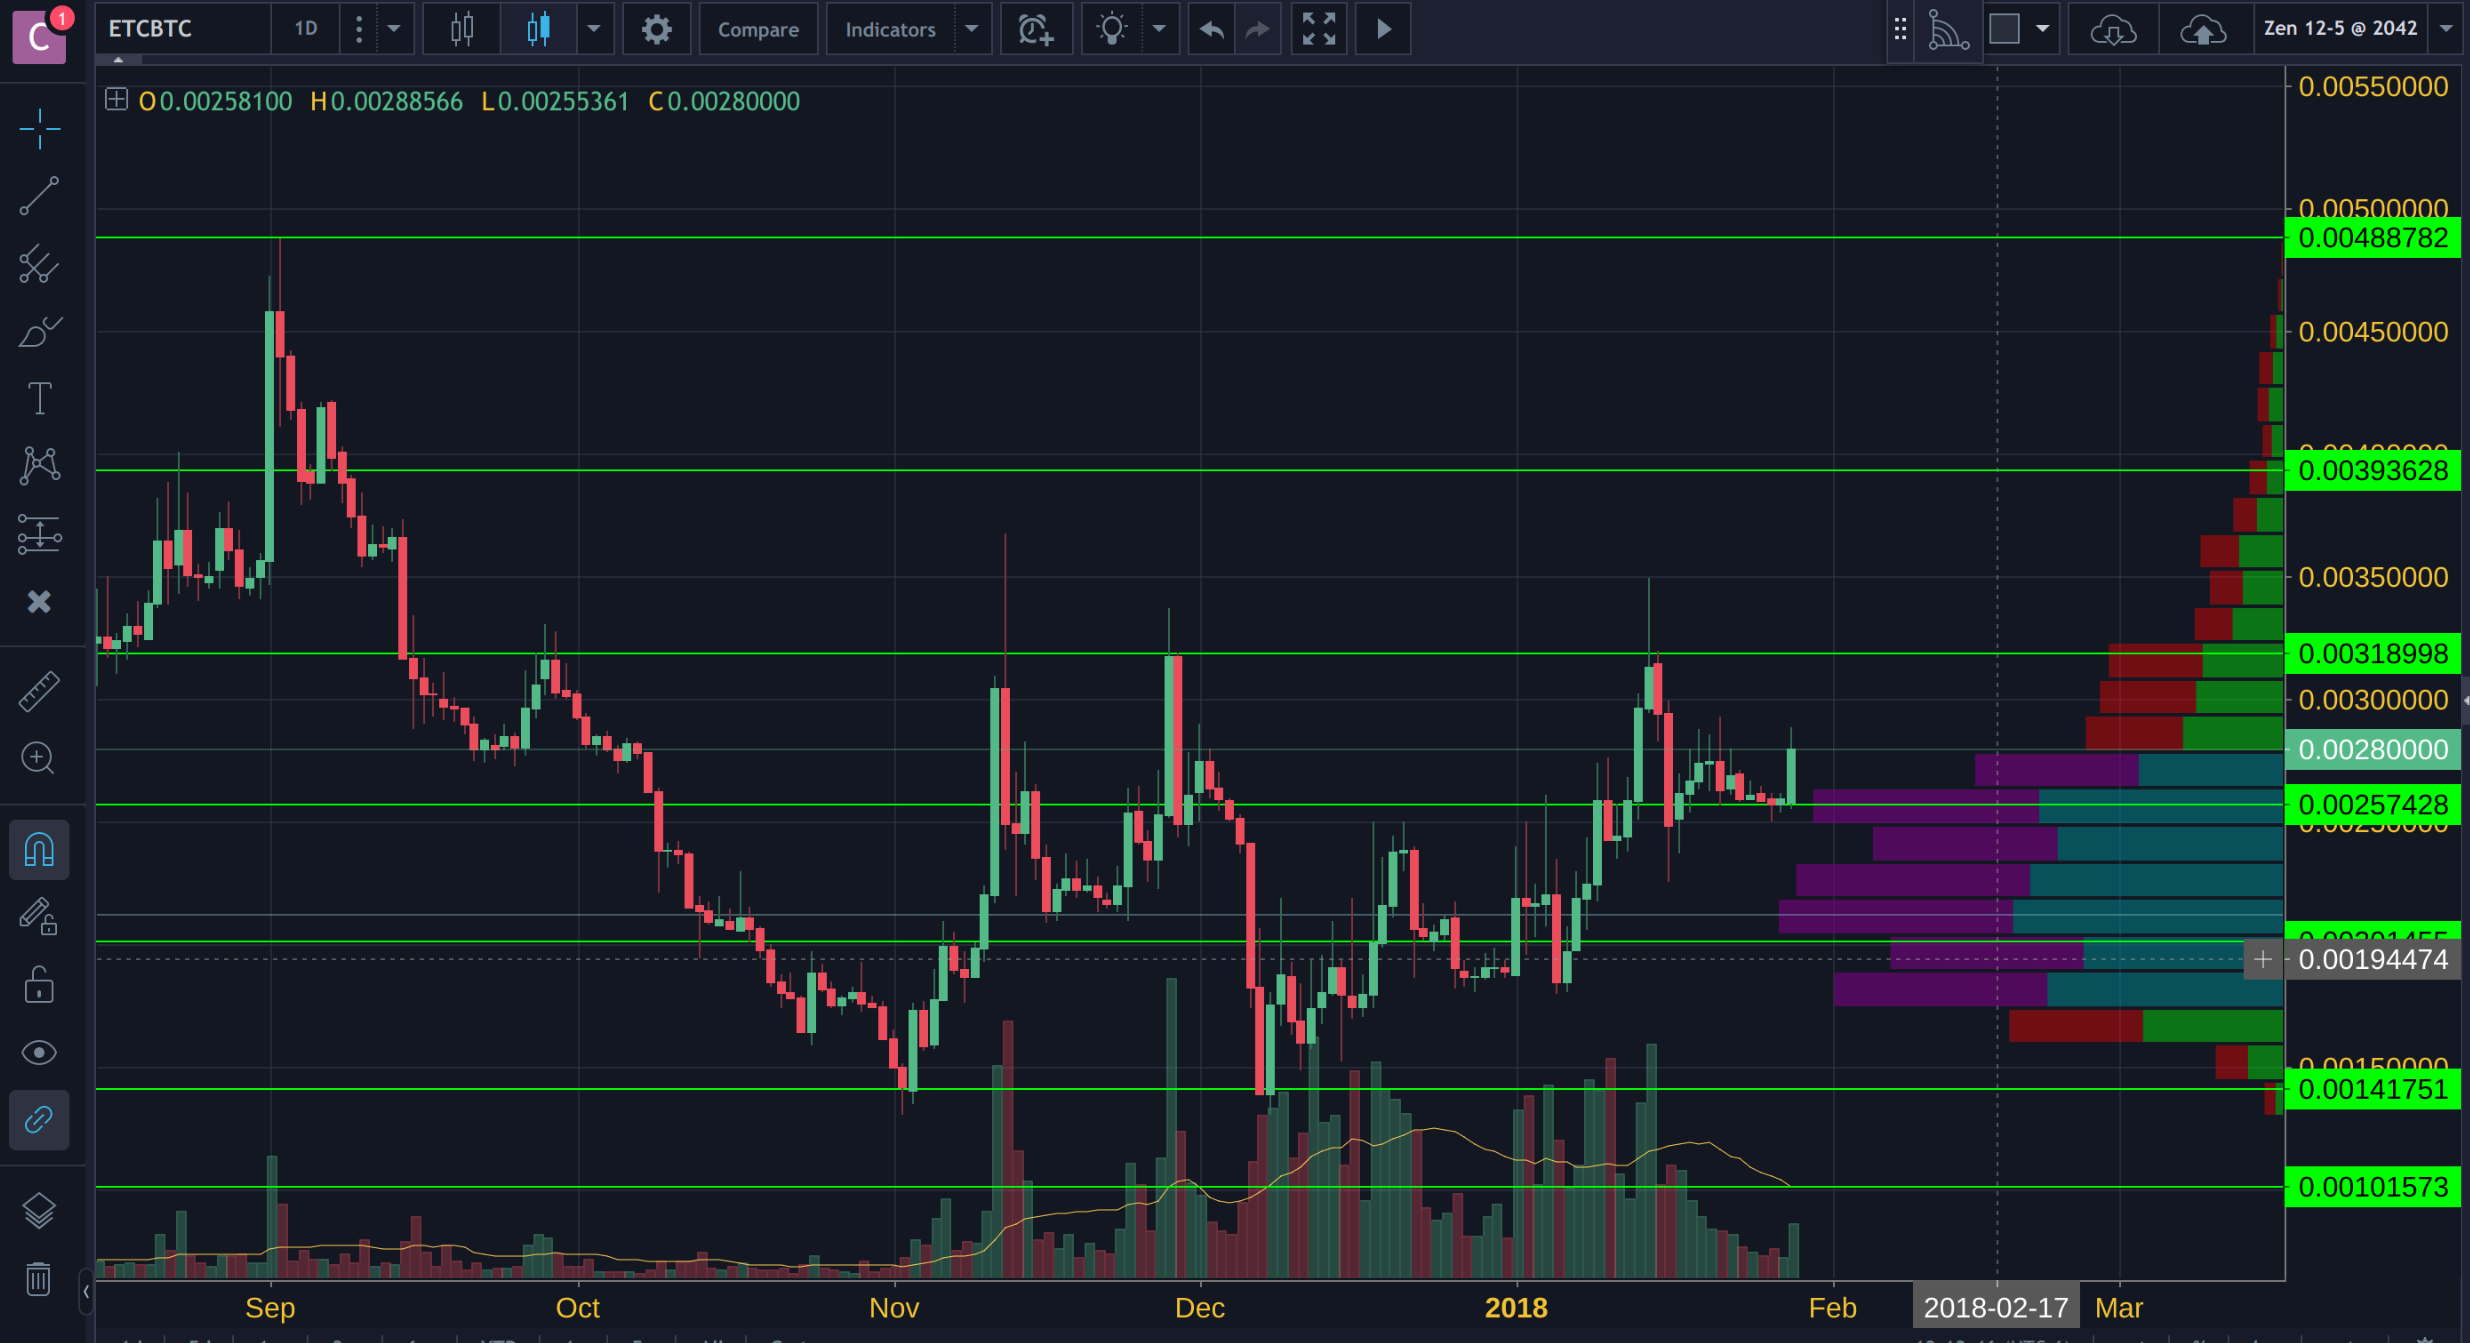
It is very likely for the price to drop down again to the 0.002BTC area, and Im saying this based on what I see with the visible range. It is also very clear from today's activity that the market is testing that support base and the one around 0.00318998.
If you go all in on trades, you're not managing your risk very well. If you want to stay in the game and have solvency always consider placing graduated trades on both sides of the price action so you aren't left out, especially when you might be right. You want to be rewarded when you're correct!!
I hear there is a hard fork coming in March, if I was invested I'd be trying to stack at a low price if I believed in the market!
This post which was heavily focused on the Visible Range and Volume.
This was all for entertainment purposes and not meant to be financial advice.
If you enjoyed this post RESTEEM, UPVOTE, COMMENT, AND SPREAD THE LOVE LIKE GREASE AT A SLIPPERY DISCO PARTY!!!!
Peace