BTFD? Long and Short Trends of Steem vs. US Dollar

Yesterday I touched on why I've been buying some Steem as of late, and I used the Steem vs. Bitcoin chart to demonstrate my reasoning.
Today I'd like to show the Steem vs. US Dollar chart, again to demonstrate why I think Steem is still sitting in a good spot to buy.
Everything I say in all of my posts is my own opinion. Obviously you should form you own opinion first, and then consult the opinion of others -for comparison only- in order to make your own decisions.
The USD price of Steem has three positive things going for it. The shorter trend is a descending wedge, outlined by the purple dashed lines, which is somewhat bullish. The longer trend shows Steem forming a near perfect pennant, outlined in the solid orange lines, albeit the top trend line isn't established that well. Lastly, the RSI is in the low 40's, and just coming out of the oversold territory.

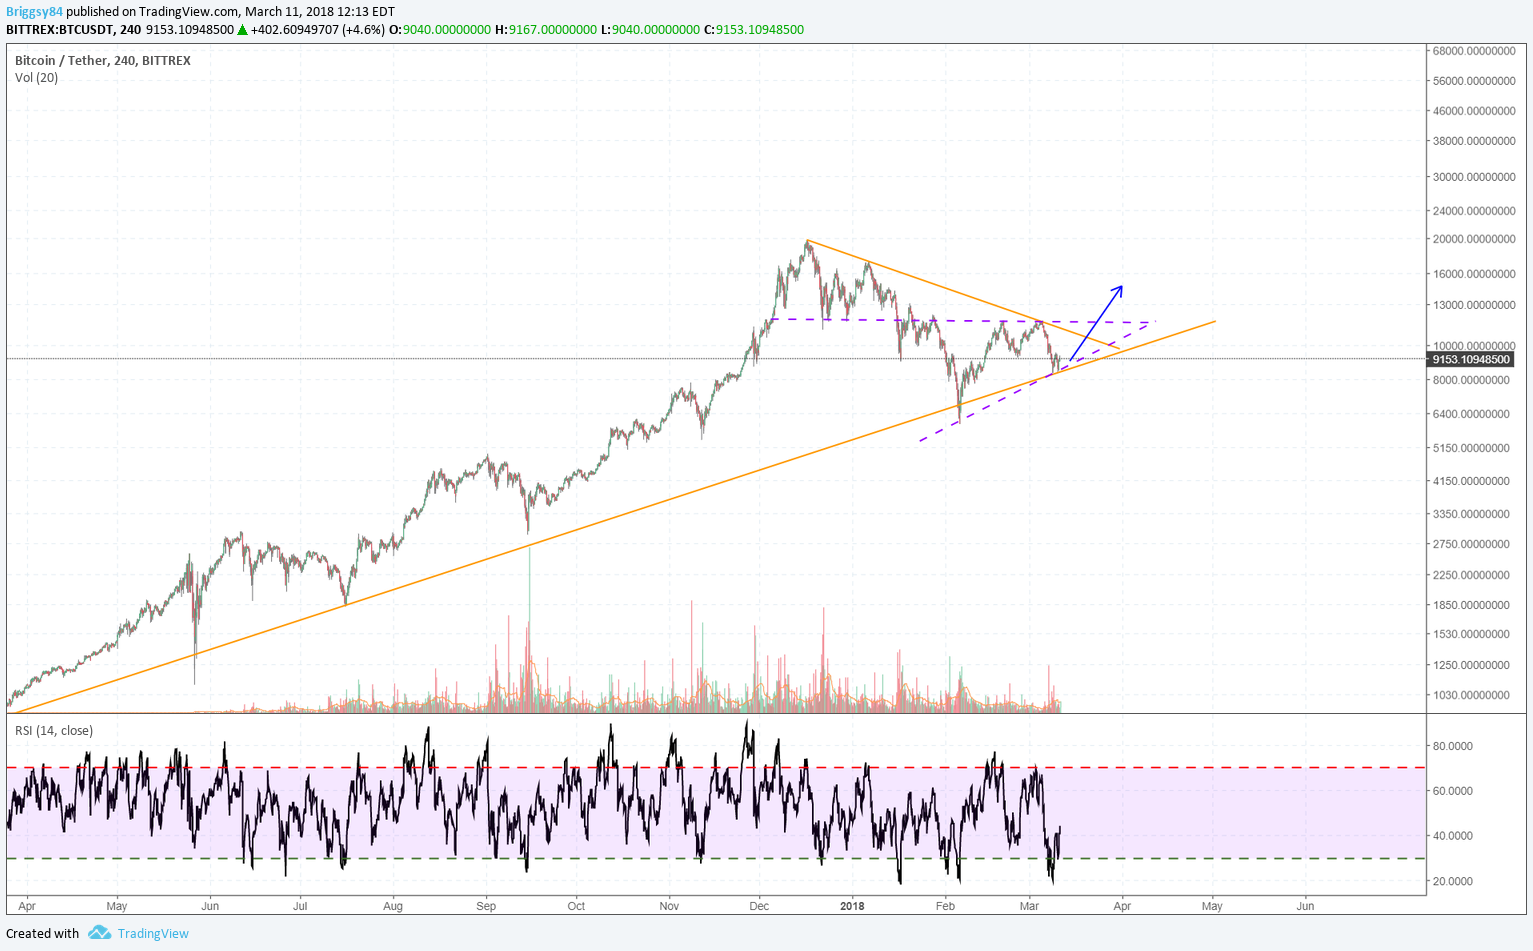
If we compare to the long trend of Bitcoin vs. US Dollar, we can see that Bitcoin has an ascending triangle pattern that is bullish, as well as the same pennant formation on the long trend. The RSI is also on the bullish side. People can call all the gloom and doom they want to, but even a stopped clock is right twice a day.
Thanks for reading and try not to lose your head in this crazy and blood-thirsty cryptomarket.
Tip Jar:
Dogecoin DDizpbLrYzFNEZtEVvUXo8kKBKu3K7yLry

You are right @briggsy.It is very hard to know the cryptomarket totally . It is always fluctuate. :(
Steem has intrinsic value and has real life applications as a technology, social media and monetary system. Longer term I see STEEM taking off like a rocket🙂