STEEM Price Analysis – January 18, 2017
The STEEM price appears to have broken out of its multi-week range and may be set to move higher in the near-term.
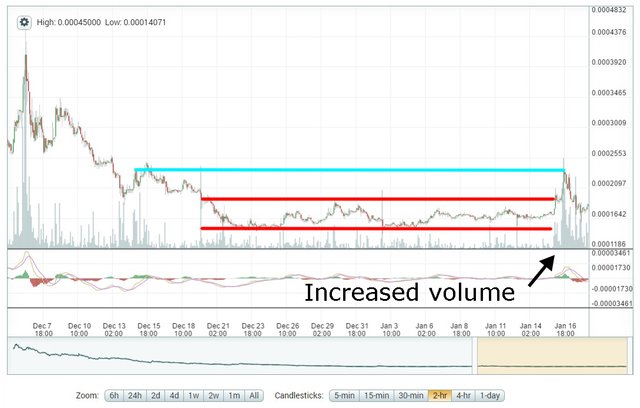
Prices have been trading higher over the last couple of days, relative to Bitcoin. Compared to the BTC price, STEEM has made some new gains and broke out of the range that had contained it since December 20th. On the Poloniex chart, you can see the range that it was in (red) and the most recent peak at ~0.0002375 BTC (blue).
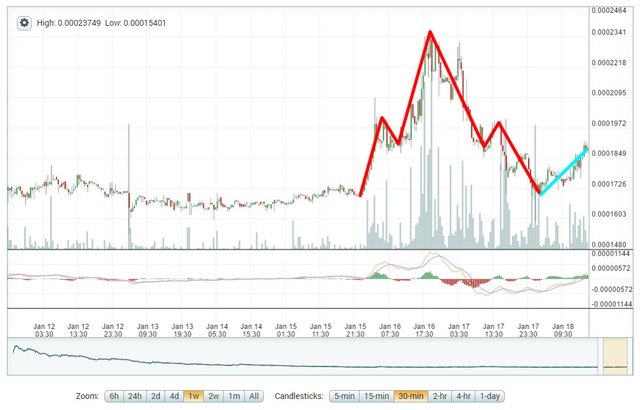
The STEEM/BTC price appears to have made a head-and-shoulders pattern, which would typically indicate a price reversal. But without a clear trend, there isn't much to "reverse." In this case, the STEEM price is moving higher over the past 18+ hours.
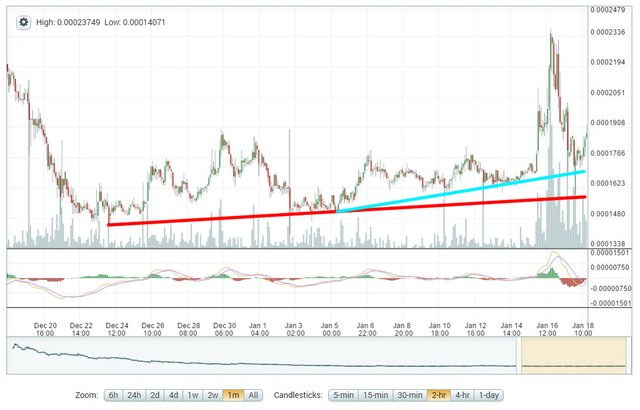
We can also see a slight uptrend over the past month, and then a slightly accelerated trend over the past two weeks, coinciding with the head-and-shoulders pattern over the last couple of days.
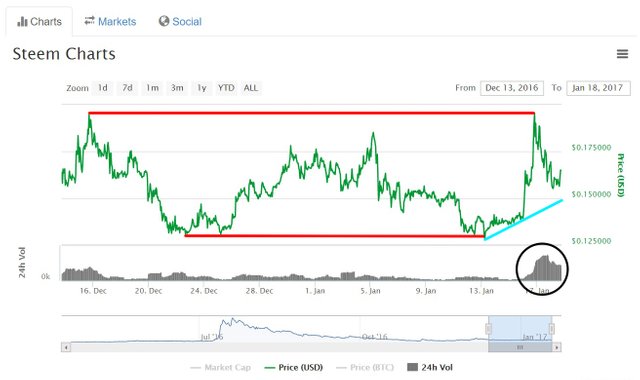
Looking at the price chart from Coinmarketcap.com, we get a slightly different picture of the price action in Dollars. The head-and-shoulders pattern is not as pronounced and the recent high did not exceed the previous month’s high of ~$0.19. We do see the uptrend and the increase in volume – currently just over $300,000 over the past 24 hours – but I would like to see a breakout above $0.19 to really confirm a new trend, otherwise, the actual price range in Dollars will still be intact.
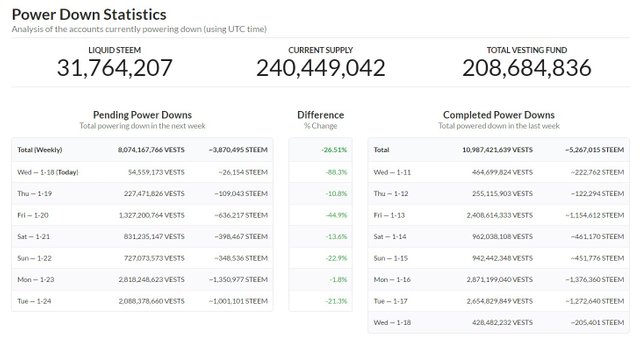
Power down statistics from Steemdb.com show another week of decreased divesting schedules. Liquid STEEM is now ~13.2% of the total supply. The liquid supply has increased by ~2.4 million since January 10th, which is a rise of ~8.4%. Total vested STEEM is ~86.8%, compared to ~87.8% on January 10th.
It’s hard to say where the price will go from here, but it could very likely move to newer highs for 2017. With the release of the recent road map, users and investors will have something to measure progress and will have expectations that will either be met or not. This can have an impact on confidence and price movement going forward. We also recently had an update from @busy.org about site development and the coming beta testing.
Alt-coin prices like STEEM are still very much connected to the price action of Bitcoin, so recent swings in the BTC price have had an effect on STEEM price action. So that’s something that traders and investors will also need to continue monitoring.
At this point, it’s a bit risky to buy STEEM at current prices for short-term trading. I would wait for a confirmation of a breakout above $0.19 or a drop to the bottom of the recent range at ~$0.13 - $0.14. But don’t use this as trading advice – it’s just my observations. See the disclaimer below.
Comments and critiques are welcomed.
Disclaimer: I am not a professional advisor and this info should not be used for trading. I would be flattered that you think so highly of my fairly basic analysis, but it would not be prudent to use this for transacting with real money.
*Charts are from Poloniex and Coinmarketcap.com. Analysis is current as of approximately 1:40pm EST, January 18th, 2017.
Follow me: @ats-david
Head and shoulders reversals for bottoms are the inverted forms of the reversals for tops. They'd be better named as "dick and balls reversals", since both shoulders and the head should be bottoms, not tops.
Example of H&S Top and H&S Bottom Reversals
Yes, that's a good catch. I worded that poorly. It would typically indicate a reversal, but there has really been no clear trend over the past month. Coming off of the right shoulder, the STEEM price has actually increased.
Thank you. I have edited that part of the post.
If the price can't break through the neckline, we'll probably see it move lower in the short-term. On Poloniex, it has already tested that neckline and retreated down, slightly.
Thanks, I liked the technical analysis. But based on the last 3-4 months since I joined this platform, seems like the price of Steem is still largely driven by news and sentiment, not by technical analysis. Technical analysis still holds, for some pattern formations inside a news event or a corridor. But breakouts are made by news (again, this is based strictly on what I saw during the last 3-4 months).
From this point of view, I see Steem at $0.24 in February. But don't trade based on my assumptions. :)
Yeah - most markets are driven by psychology. The analysis of price movements and patterns is mostly about that. Fundamentals are helpful, but sometimes they don't even matter. STEEM and most crytpo-coins move mostly on speculation, so identifying patterns can be pretty useful, as that's likely what many other traders are looking at as well. It's certainly not exactly predictive.
So, you think $0.24 in February? The end of the month, or just reaching that price some time during the month? And why $0.24?
End of the month, after we will probably see some significant improvement in the Steemit experience (probably HF17, probably something else from the roadmap).
If you look at the coinmarketcap charts, you'll see that Steem price was twice closer to break 0.0003 BTC (for a brief time it was over but pulled back). The first surge was when Dan announced HF 16, the second when HF 16 went live. The positive sentiment tends to be cumulative and now we have more support for that (official roadmap, the feature in Forbes, and probably a few more PR features in the meantime). That's why I think we will see 0.0003 BTC at the end of February (which is roughly $0.24 at $820/BTC).
Again, don't trade on my assumptions :)
Thank you, this is much better analysis than @ozchartart .
How about an upvote for encouragement? :)
I still don't get why @ozchartart had bigger support than you
I def FOMO buying steem right now :P
Very informative, thanks @ats-david
No problem. Thanks for reading.
Great analysis! I just missed the broad view of the analysis! Keep sharing and keep analysing!
Thank you! I'm glad you like it.
Go steem go! I just hope it wasn't a bull trap. A false breakout where the price breaks to the upside but quickly retreats back into the previous trading range before breaking down in the other direction meaningfully...
Well, there's always that possibility...especially in cryptoland. The bull-trap would probably happen somewhere around 0.00020 BTC and slightly higher.
This was a show of force in my opinion, price broke the range and then made a move that was larger than the previous range. Fake breaks are generally when the market breaks out and moves a small % of the previous range, stopping people out and getting new buyers involved only to reverse. This was a full on move.
We will know more in the coming days/weeks... I hope you are right but I am not terribly confident that will be the case.
Thanks for sharing. Interesting information.
Thanks!
We're going to need to stock up on sunscreen. Ironically, the moon is very sunny.
Moonscreen? Hmm...I think I just invented something.
Off to the Patent Office!