STEEM Price Analysis – December 14, 2016
The STEEM price is generally moving as expected and is testing another support line.
On the first day of The Dumpening, the STEEM price has fallen from the $0.19 - $0.20 support line to $0.15 - $0.16 support. Volume has picked up, but it’s still much lower than it was during the peak of trading last week. As it has increased, prices have fallen. Selling pressure was heavy today and it should continue into the latter half of this week.
To the charts we go…
I want to return to a chart that I’ve used a couple of times in the past week. Looking at the different uptrend lines, we can see that the STEEM price has now fallen through two of them at previously established support.
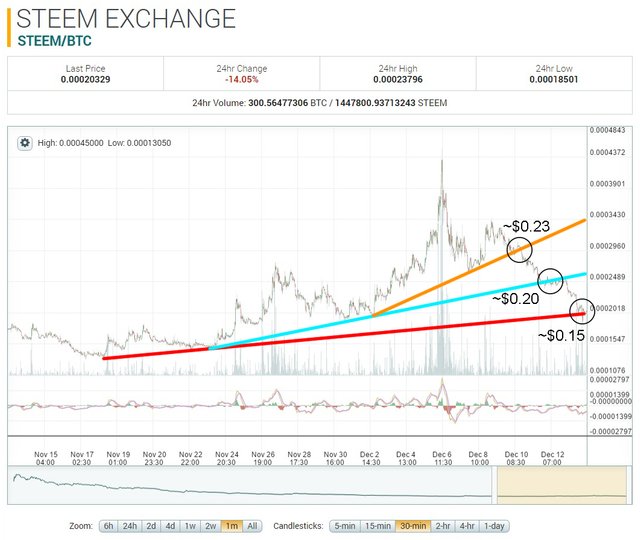
With increasing volumes of previously locked-up STEEM becoming available this week, and with an increase of trading volume that has not been good for the STEEM price in the past, these breaks in the uptrend lines and support don’t look good in the near-term. The price is still steadily moving down from the last peak on December 6th.
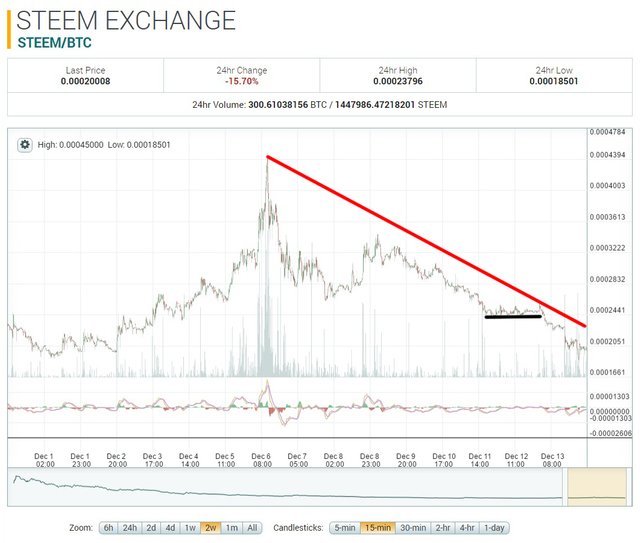
Something fairly unusual happened on December 12th, as we can see on the chart from Poloniex. The STEEM price traded in a very narrow range – almost straight sideways for essentially the entire day. It slid along just below $0.20, touching it a couple of times. As mentioned in previous posts, the old support lines become new resistance, and we see that the STEEM price was unable to break back through to the upside.
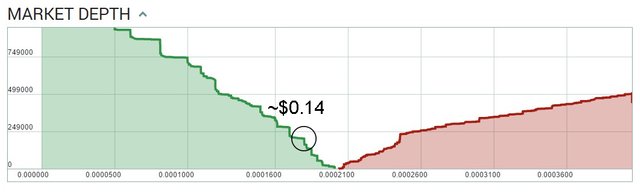
We’re seeing some sell orders stacking up just above current prices, which are ~$0.158. Based on current buy orders, there is some support building, but it’s mostly below the established support line in the $0.15 - $0.16 range.
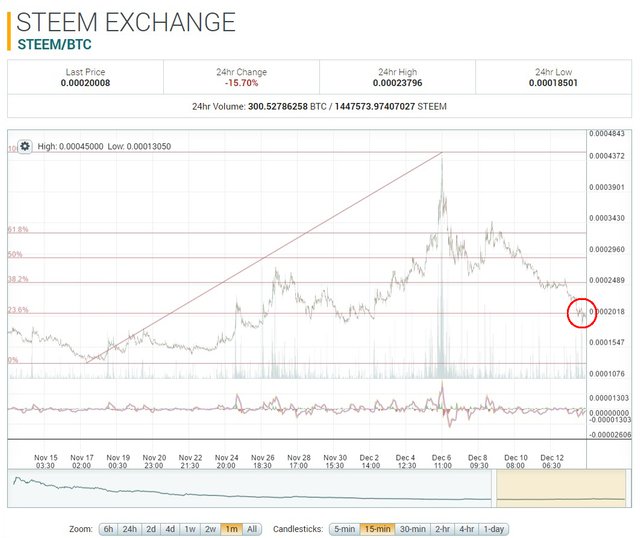
Let’s get slightly more technical for a minute. Based on Poloniex history, the Fibonacci retracements on the 1-month Poloniex chart shows the current price just below the 23.6% line, based on the November 17th low at $0.10. This may not be relevant right now and I don’t typically look to Fibonacci lines for analysis because my posts aren’t meant to be used for short-term trading, but it can help to ascertain where the next stop will be – and it appears that the price may be headed back down to $0.10 when we consider all of the other data.
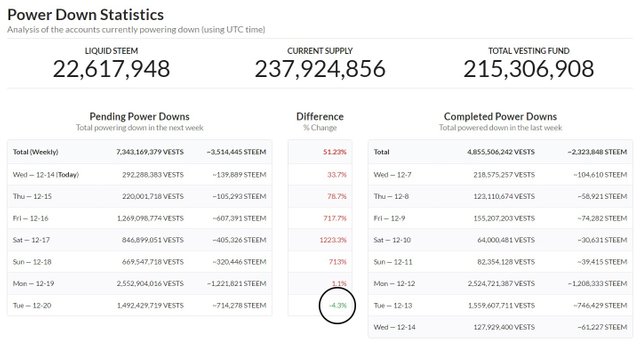
If there is a bit of good news looking ahead to next week, it’s that we can currently see a decrease in STEEM that will be available from power down schedules next Tuesday, December 20th. This may just be a result of some users being content with only a single-week power down. In any case, seeing green is better than seeing a lot more red, so we’ll take what we can get.
The Dumpening has begun, but we have so far survived the first day. I predicted that the STEEM price would see $0.15 by the end of the day on Tuesday and the price hit that mark. If you’re looking for a good place to buy STEEM for the long-term because you believe the price will be higher a few months or years from now, current prices are looking good. Don’t buy in all at once. The price will likely go lower in the near-term and you’ll probably have better entry points to maximize your purchase (assuming that the Bitcoin price does not dramatically change).
Again, these are just my opinions, so please consider other analysis and don’t take risks that you cannot afford to take. Read that disclaimer below!
Disclaimer: I am not a professional advisor and this info should not be used for trading. I would be flattered that you think so highly of my fairly basic analysis, but it would not be prudent to use this for transacting with real money.
*Charts are from coinmarketcap.com and poloniex. Analysis is current as of approximately 12:40am EST, December 14th, 2016.
Follow me: @ats-david
Thank you another great post, I like your posts, and seems sometimes a bit technical and hard to understand being new to trading, yet very informative. I really am starting to learn about all the indicators for trading, and this does help out a lot.
I appreciate that. If you ever have any questions about the charts that I show you, just ask.
Will do, glade your here trying to help others like myself learn.
I wish I could just upload. But I have to wait 20 more mins. So annoying.
Amazing article.
Thank you.
Upvoted and resteemed!
Thanks for the analysis, it makes sense to me :)
Oh, good. I'm glad it makes sense to somebody. Thanks for reading!
There is hope ;)
We need more Bloggers and less visitors
Great analysis! Always a pleasure to read this in the morning.
Thanks!
Mmm very interesting, Just what I expect from my reasearch and your post you've made. Thank you for all the help. Going to start buying back between .10-.05 cents
I have a question though. How directly related is SBD to steem? If the price of steem falls to .10 will the price of SBD immediatly fall too? Or is it not that simple?
SBD is pegged to the U.S. Dollar. It should typically buy you $1.00 worth of STEEM.
If the STEEM price is $0.10, then you should be able to buy ~10 STEEM for 1 SBD. If the STEEM price falls to $0.05, then you should be able to buy ~20 STEEM for 1 SBD.
As long as the peg holds, you should generally be able to receive $1 U.S. worth of goods or services. That's the long-term plan, anyway. So far, the peg has basically held as intended.
Yeah but sometimes it is 97 or 98.
I was just wondering how dependent holding that peg is to the steem price but from what you are saying it is not dependent at all. is that really true?
why does the peg fluctuate then? what causes it to sometimes be slightly lower or higher?
Good stuff, I actually understand that LOL. Thumbs Up sir.
Spot-on analysis, this lines up with my own thinking as well. I won't start buying again until we get close to re-testing the all time lows.
There is a chance that we don't dip down to $0.10. So, if you're buying for the long-term, don't put it off for too long. Buying in as the price falls isn't a bad idea at this point, if you've already decided that you want it for a long-term hold.
Good point, maybe I'll put in a couple more buy orders at different levels along the way. I'd be kicking myself later if it came within a hair's breadth of my order but didn't quite trigger it (that happened once with ETH, it was one of those "aaargh!" moments)
Great chart analysis and explanations for all of us, esp. for those of us learning the way.
RS for you also. Thanks for the work on the post!
Thanks David,
Good job. I've never really gotten the hang of TA, though I've dabbled in EW and have some understanding.
I sold into the spike, trading for ETH, so did quite well one some of it. Sold some for BTC too. Very happy with those trades. Now I have some layering under these levels if we go down more, which I still suspect we will. While powerdowns may have diminished, it's still a lot more volume that can be powered down than a few weeks ago, so I expect the downward pressure to continue for a few months. But, I'm just thinking out loud... no TA here.