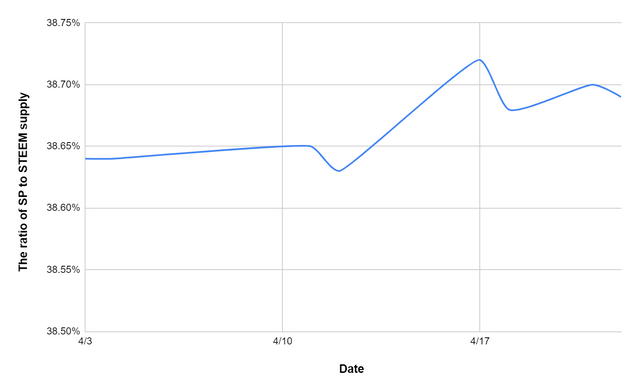
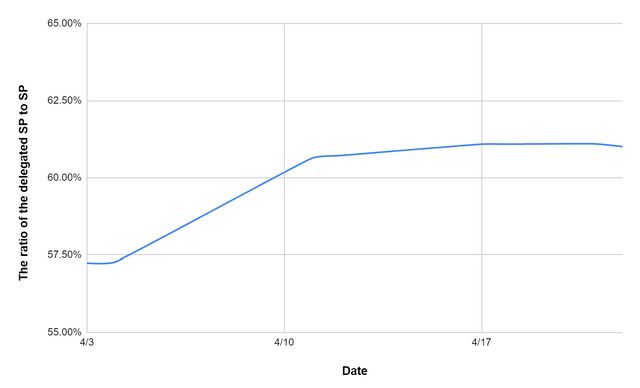
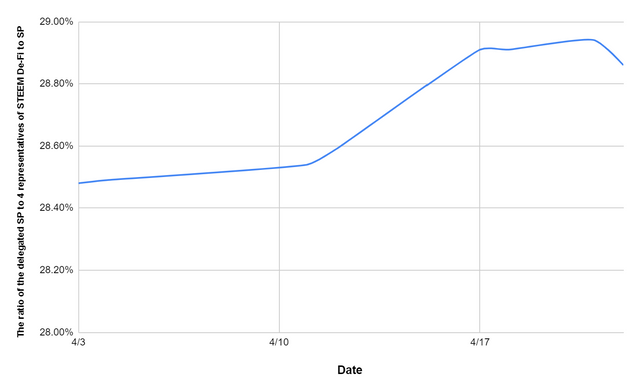
Apr, 2022 STEEM On-chain chart analysis
Apr, 2022 STEEM On-chain chart analysis is more accurate than the one I published last week. My previous analysis may not be valid anymore due to the Steemit team's latest changes in the blockchain, as well as due to the rapid increase of people signing up on Steemit and thus increased network load. Thank you @steemnova and @pfunk for providing valuable insights and corrections on this subject. Any feedback or comments are appreciated. Thank you for reading!

Last week’s recap
We discussed market cycles and how they play into past and future performance of Bitcoin. We see a repeat of $200 price drop coming up in April when Bitcoins price bottoms out before rising again to high over $12000 by year end. We also introduced Gini coefficient as a measure of wealth inequality. It turned out we were right on both fronts with Bitcoin bottoming at $4500 per unit and rallying to over $8200 by next month. Here’s another case where data seems to be repeating itself.

Technical indicators
A number of indicators exist for technical analysis. A few of them include: price trend lines, trading volume patterns and moving averages.
