Analysis of Volume YTD for Pump & Dump Strategies
Index - https://steemit.com/tax/@alhofmeister/accounting-and-finance-blog-index
Introduction
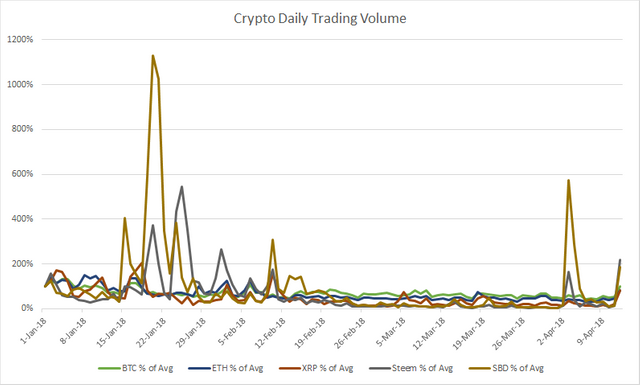
With the latest spike in Steem/SBD, I thought it would be interesting to examine the trading volume of Steem, SBD and the largest cryptocurrencies. Although high trading volumes do not necessarily indicate market manipulation, the likelihood of organic trading at +3x the YTD average trading volumes in a single day are unlikely. In my analysis, days suspected of pump and dump schemes are identified by trading values over 3x the average daily value. As the market capitalization of SBD is significantly lower than Steem, it is more susceptible to manipulation.
Chart
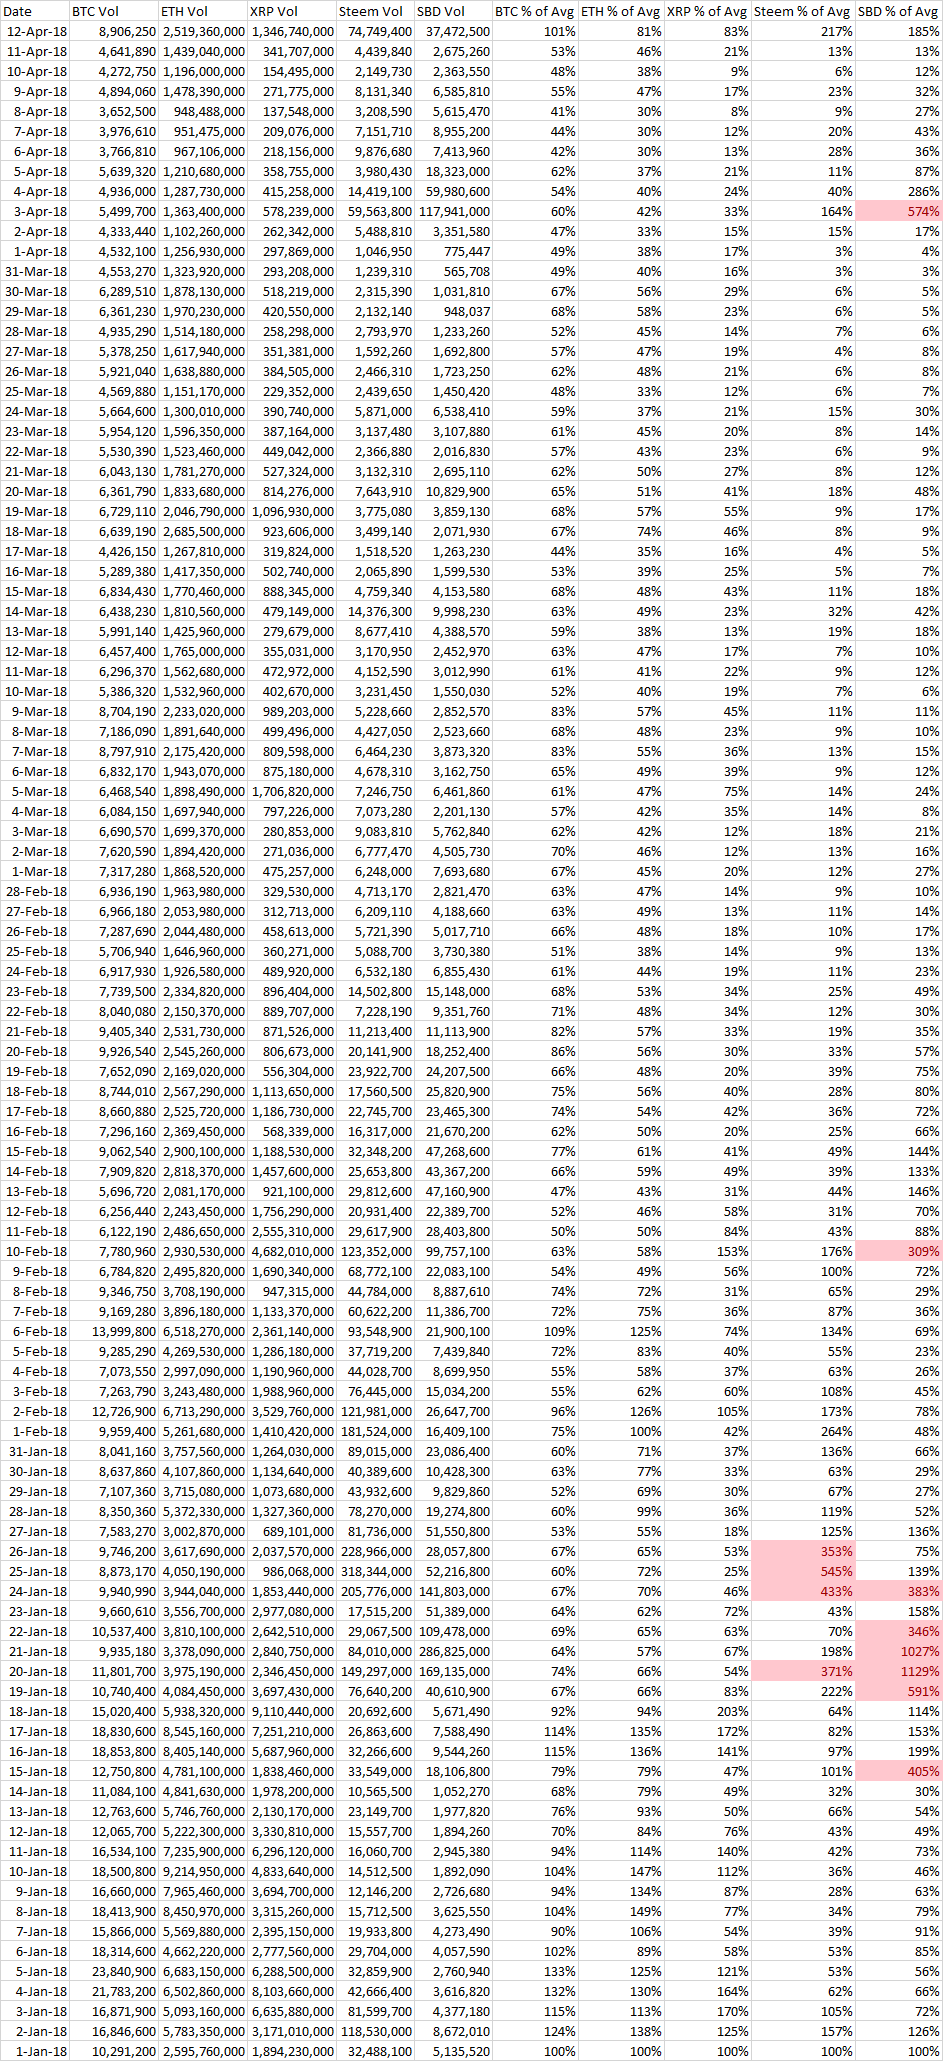
Raw Data
References
https://coinmarketcap.com/currencies/bitcoin/historical-data/
https://coinmarketcap.com/currencies/ethereum/historical-data/
https://coinmarketcap.com/currencies/ripple/historical-data/
https://coinmarketcap.com/currencies/steem/historical-data/
https://coinmarketcap.com/currencies/steem-dollars/historical-data/
@contentvoter
The volume did coincide with the massive surge in bitcoin, so there's that factor. If this pump took place while everything else was flat, I'd be a lot more suspicious.
Yeah, the latest surge in value was consistent across the entire cryptocurrency market which makes a pump and dump unlikely (for today and yesterday). There was no such corresponding surge on 4/3 or 1/24 - 1/26 or 1/19 - 1/22 though.