Crypto Historical Performance (BTC, ETH, XRP, Steem & SBD)
Index - https://steemit.com/tax/@alhofmeister/4njxqk-accounting-and-finance-blog-index
Introduction
In this post, I wanted to examine the seasonal price fluctuation of BTC, ETH, XRP, Steem & SBD. Note that 2017 was an outlier year (everything increased exponentially), and is presented on a second y-axis for BTC, ETH & XRP. YTD performance is calculated as follows:
Current day price / January 1 price
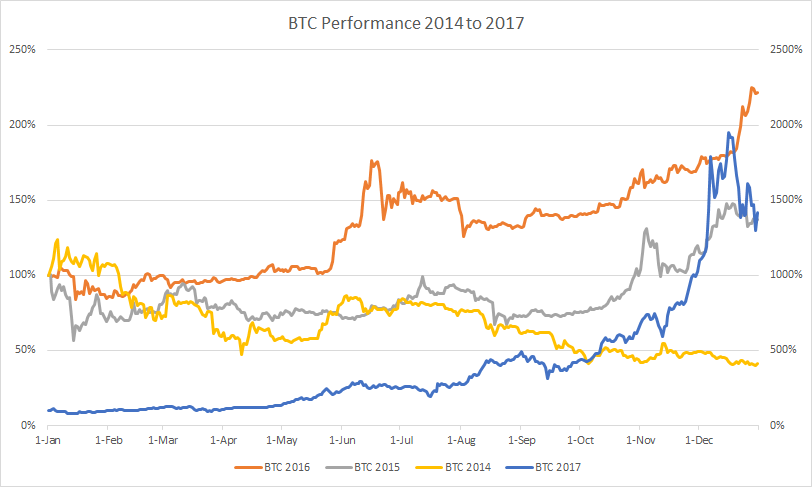
BTC Performance
Except for 2014 (price peaked in January), the price for BTC has consistently reached it's peak in December.
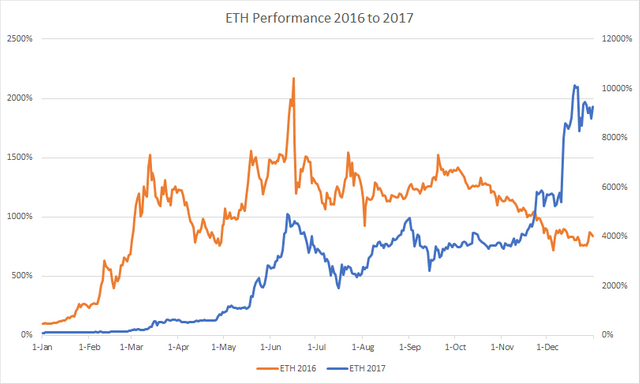
ETH Performance
ETH peaked in June during 2016 and reached it's peak in December during 2017.
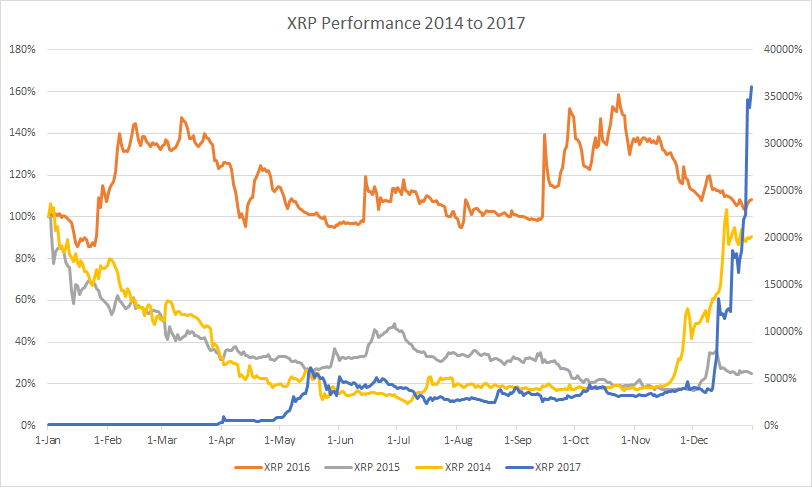
XRP Performance
XRP peaked in January during 2014 & 2015. The peak for 2016 was reached in November. 2017 is the year that XRP took off during December.
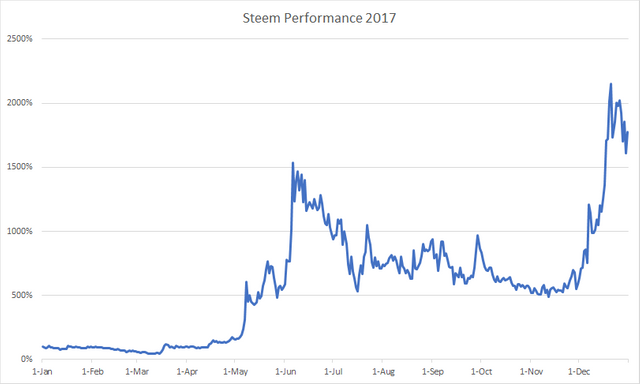
Steem Performance
Steem reached it's peak for 2017 during December.
SBD Performance
SBD reached it's peak for 2017 during December.

References
https://coinmarketcap.com/currencies/bitcoin/historical-data/
https://coinmarketcap.com/currencies/ethereum/historical-data/
https://coinmarketcap.com/currencies/ripple/historical-data/
https://coinmarketcap.com/currencies/steem/historical-data/
https://coinmarketcap.com/currencies/steem-dollars/historical-data/
@contentvoter
Good summary, thanks
Coins mentioned in post: