Crypto YTD Performance (BTC, ETH, XRP, Steem & SBD)
Index - https://steemit.com/tax/@alhofmeister/2dob8f-tax-blog-index
Introduction
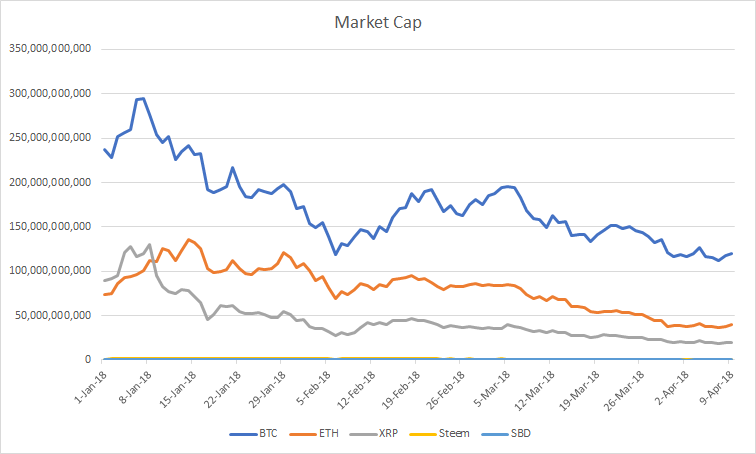
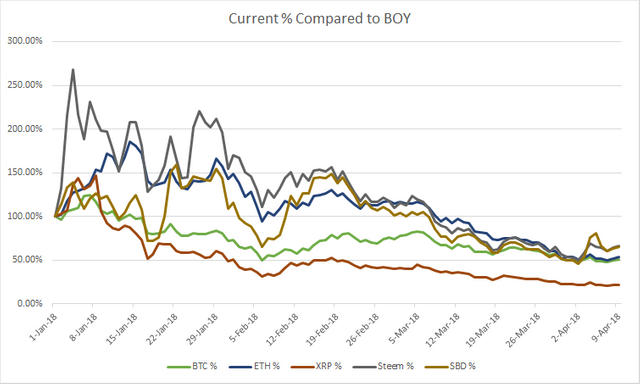
In this post, I wanted to present two graphs. The first graph shows the total market capitalization of the 3 largest cryptocurrencies compared to Steem & SBD (demonstrating the growth potential and the relatively small market share of Steem & SBD). The second graph shows the year to date performance of each of the 5 cryptocurrencies (current market cap / market cap as of January 1). As demonstrated by the second graph, none of the currencies are above their January 1 level, but Ripple has significantly under performed compared to the rest of the group. Also note that Steem and SBD have been outperforming BTC and ETH. By examining the daily trading volume of SBD & Steem on 4/2, it becomes obvious that a pump and dump occurred. This will be another recurring article that tracks the performance of the aforementioned cryptocurrencies.
Market Capitialization
YTD Performance
References
https://coinmarketcap.com/currencies/bitcoin/historical-data/
https://coinmarketcap.com/currencies/ethereum/historical-data/
https://coinmarketcap.com/currencies/ripple/historical-data/
https://coinmarketcap.com/currencies/steem/historical-data/
https://coinmarketcap.com/currencies/steem-dollars/historical-data/
@contentvoter
Good job brother 👏👏👏👏👍👍
Coins mentioned in post: