Plot Bitcoin and Ethereum price graph using python mathplotlib program
Introduction
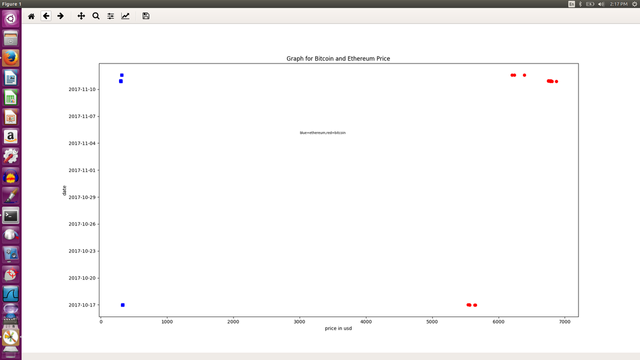
Last post we have seen how to plot bitcoin price in a graph. You might have seen multiple crypto currencies plotted in a single graph. This post we will see how to program and plot multiple crypto prices in a single graph.
Program Explanation:
The program get the bitcoin and ethereum prices from mysql database table through select queries. We store the cursor result of these queries to 'result' and 'result1' objects and read the records through a 'for' loop.
below lines in the program gives labels to the X axis and Y axis.
plt.xlabel('price in usd')
plt.ylabel('date')
You can also give text and title for your graph using below lines of code. read more https://matplotlib.org/users/text_props.html
https://matplotlib.org/api/_as_gen/matplotlib.pyplot.text.html
plt.title('Graph for Bitcoin and Ethereum Price')
plt.text(3000,736638,'blue=ethereum,red=bitcoin',fontsize=7)
In order to separate different Coins, we can color them with blue and red using below lines of code.
plt.plot(time,price,'ro',time1,price1,'bs')
Note: you need to give you username and password to connect to your mysql database in the below program
Full program:
import sys
import matplotlib.pyplot as plt
import pymysql

#connect to mysql database

con = pymysql.connect(host='127.0.0.1',user='username',passwd='password,db='mysql')
cursor = con.cursor()

cursor.execute("select date_time,price_usd from crypto_table where id ='bitcoin'");
result = cursor.fetchall()

cursor.execute("select date_time,price_usd from crypto_table where id = 'ethereum'");
result1 = cursor.fetchall()

time  = []
price = []

for record in result:
        time.append(record[1])
        price.append(record[0])

time1 =[]
price1 =[]
for record in result1:
        time1.append(record[1])
        price1.append(record[0])
plt.xlabel('price in usd')
plt.ylabel('date')
plt.title('Graph for Bitcoin and Ethereum Price')
plt.text(3000,736638,'blue=ethereum,red=bitcoin',fontsize=7)
plt.plot(time,price,'ro',time1,price1,'bs')

plt.show()
Output:

