STEEM-flow monthly report #8
Average STEEM flow intensity for last 5 months:
My previous weekly report -> STEEM flow report #7
Investigating STEEM price chart, it seems to me that STEEM business was sleeping before sunny month May. Then go to alive in June and roller-coasters are started.
STEEM price chart
April and May was months when STEEM actively flow to exchanges and then flow went down. In July STEEM mostly returning from exchanges to the Steem accounts.
In opposite SBD massively flowed away to exchanges only from June and returning mostly in August.
To/From exchange ratio shows that liquid STEEM returning from exchanges in July and SBD in August.
It could be explained by SBD price on exchanges in June was sometimes over 2 USD! In July SBD price returned to ~1 USD and conversion to STEEM had became more profitable inside STEEM blockchain.
SBD price chart
That is why internal SBD conversion was popular in July-August with attractive feed price still more then 1 USD. SBD burning to "@null" account for post promotion is increasing from month to month as well.
Power down as usually prevails in constant rate about 400 STEEM per minute in average with a peak in June.
Very good material. This is invaluable to help see where the money is flowing from and to.
Please keep up the good work.
STEEM On!!
DaveB
Thank you a lot! I'm glad you find it useful.
Update #9
Very good stats. Is the fact that more steem seems to be going out (powering down) than is coming in a cause for the fall in price?
I know all cryptos are down the last few days but it only makes sense that the price is being depressed by this. So why is it happening? Arent the whales, the ones who could move that much out, dedicated to the long term?
In my opinion, as I see Withdrawals has constant rate in average and STEEM flow prevails in direction to exchange. It is definitely a pressure to ex-rates. Only new users constantly growth and STEEM demand increase could support the price in long term.
STEEM price is correlated to Bitcoin price as well. So, now BTC drops (price correction) after unprecedented historical growth and pulls other alt-coins down.
Why is steem correlated to the price of BTC?
I figured most altcoins tend to go in the opposite direction of BTC. Of course, the last couple days all go in one directions since the entire sector was painted very red.
You could see all coins mostly red: https://coinmarketcap.com/. BTC is almost a half of whole market and shows the main trend for investors.
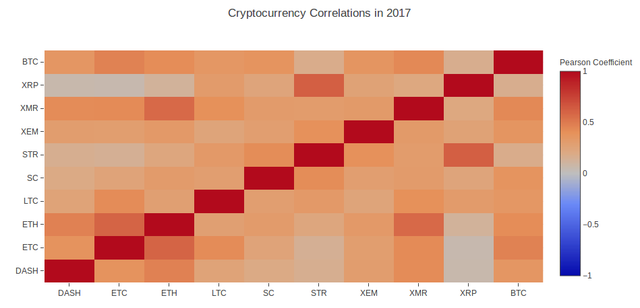
Here I found some research with proof: https://cdn.patricktriest.com/blog/images/posts/crypto-markets/Cryptocurrency-Pricing-Analysis.html