Skewness & Kurtosis In R
Hi there. This post is on the statistics topics of skewness and kurtosis. For simplicity, math formulas for sample skewness and sample kurtosis are not presented.
Skewness
Skewness is a measure of asymmetry and there are three types.
Zero skewness implies symmetry. This is where the mean, median and mode are all equal. A probability distribution that has symmetry at its mean is the ever famous normal distribution.
A skewness that is non-negative or above zero implies a positive or a right skew. This is when the mode is less than the median which is less than the mean.
A below zero skewness implies a negative or left skew of the frequency distribution. The mean is less than the median which is less than the mode.
Notice how the median is in the middle of each of the inequalities above hence the word median. Due to this, you can just compare only the mean and mode.
The visual below summarizes skewness:
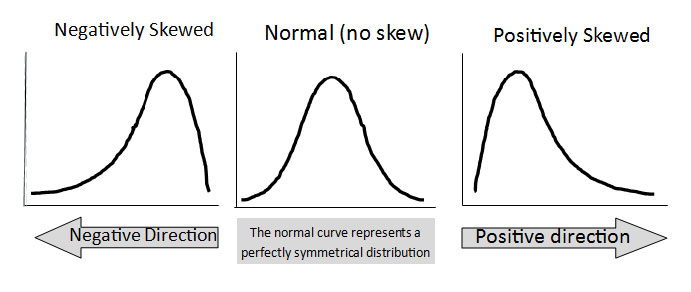
Image from: http://www.managedfuturesinvesting.com/managed-futures/news/aisource-news/2015/10/13/what-is-skewness
Kurtosis
Kurtosis is a measure of the peakedness of a probability/frequency distribution.A diagram will be given below to help visualize this concept.
When it comes to kurtosis there are three types of kurtosis and the concept of excess kurtosis. Excess kurtosis can be represented as a formula as:
The (famous) Normal Distribution or Gaussian has a Kurtosis of three or an excess kurtosis of zero. We also say that the normal distribution is mesokurtic.
A leptokurtic distribution has a higher peak than a normal distribution. The kurtosis is above three and the excess kurtosis is above 0.
A platykurtic distribution has a shorter peak than a normal distribution. The kurtosis is below three and the excess kurtosis is below 0.
The following diagram is a great visual which summarizes the concept of kurtosis.

Example In R
In the R example, the focus is on (fake) test scores from a math test.
grades <- c(68, 92, 55, 80, 81, 40, 39, 51, 88, 65, 67, 59, 77, 91, 84, 70, 62, 68, 79, 81, 89, 94, 91, 55, 57, 48, 20, 83, 72, 71, 70, 89, 91, 93, 66, 55, 52, 67, 78, 33, 46, 80)

hist(grades)
You can find the mean() and median() in R of the sample data.
mean(grades)

## [1] 68.97619

median(grades)

## [1] 70
To find the skewness or kurtosis of a sample dataset, you can use the moments package in R to run the skewness() and kurtosis().
# Load moments package for skewness & kurtosis:
# Use install.packages("moments") to install the package.

library(moments)

skewness(grades)

## [1] -0.6095399

kurtosis(grades)

## [1] 2.791072
The skewness from the sample data is negative which does make sense as our median being larger than the mean.
References
- Casella, G. and Berger R.L. (2002), Statistical Inference, 2nd Edition, Duxbury
- http://www.macroption.com/kurtosis-formula/
- http://www.macroption.com/skewness-formula/
- http://www.r-tutor.com/elementary-statistics/numerical-measures/kurtosis
- The featured image is taken from http://hopeforthesold.com/a-graphic-tells-the-story-prostitution-statistics/