A Guide To Mean, Median, Mode (Version One)
Hi there. This post is about looking at means, medians and modes from statistics. I have this as version one as this is ideal for younger students with limited/no math notation. Version Two will appear in a later post where mean, median and mode will be looked at in greater depth.
Mean, median and mode are also known measures of central tendency. There are other measures for analyzing data but mean, median and mode are very common and many people can understand them.

Sections
- Mode
- Median
- Mean (Average)
Mode
The mode refers to the most frequent number or item from a set of numbers or from a table.
An alternate definition for the mode is the value that appears the most often. Here are some examples.
Example One
What is the mode from {1, 3, 4, 1, 1, 0, 7}?
The number one appears the most at a count of three. The mode is 1.
Example Two
| Dice Roll Number | Count |
|---|---|
| 1 | 10 |
| 2 | 9 |
| 3 | 9 |
| 4 | 8 |
| 5 | 7 |
| 6 | 11 |
In this example, you do not need to count as the table provides the counts for you. It is easy to see that 6 has the highest count at 11. The mode is here is 6.
Example Three
Here is a bar graph from a classroom survey of preferred ice cream flavours. What is the most preferred flavour of ice cream (the mode)?
The bars in the above image have no labels. You can see that chocolate is the most preferred ice cream flavour from the classroom survey. The count for chocolate is eight.
(The bar graph was created in the programming language R and the image is a screenshot from my RStudio program.)
Median
From a ordered list of numbers, the median is the middle number. Half of the numbers are above the median and the other half are below the median.
If there are an odd amount of numbers, the middle number is not too difficult to spot. For the even amount of numbers case, you take the middle two numbers and divide by two.
Example One
Find the median number from 2, 0, 3, 10, 4, 7, 1, 8 and 5.
The list of numbers have to be ordered first. You can sort the numbers from smallest to largest or from largest to smallest. For this example, the numbers are ordered from smallest to largest.
The median or middle number from the sorted list of numbers above is 4.
Example Two
The previous example dealt with a odd amount of numbers. This second example deals with an even amount of numbers.
Find the median number from 10, 21, 6, 36, 15, 22, 41, and 29.
The list of ordered numbers from smallest to largest is:
The number of numbers in the list is 8 which is an even number. The two middle numbers are added together and divided by 2. In this case, the median is 21.5 since 21 and 22 equals 43 and 43 divided by 2 is 21.5.
Mean
I have saved the most common measure as the last one. The mean is commonly referred to as "the average" and it is calculated by adding all the numbers together and dividing the total by however many numbers there are.
Example One
From 3 three dice, you rolled a 5, a 6 and a 1. What is the average of the three dice rolls?
The total/sum of 5, 6 and 1 is 12. The average is the total divided by 3 which ends up being 4 (from 12 divided by 3).
Example Two
Five patients at a hospital have their heights measured in centimetres. The heights are 180, 170, 168, 190, and 196. What is the average height from the five patients?
Adding the five numbers together gives 904. The average would be 904 divided by 5 which is 180.8 cm.
Example Three
A class of 12 students have been given their math tests back. The scores for this math test are:
| Student Number | Math Test Score |
|---|---|
| 1 | 75 |
| 2 | 80 |
| 3 | 81 |
| 4 | 92 |
| 5 | 61 |
| 6 | 52 |
| 7 | 47 |
| 8 | 68 |
| 9 | 70 |
| 10 | 74 |
| 11 | 86 |
| 12 | 59 |
The average math test score is 70.42 percent (rounded to 2 decimal places). This average is obtained by adding the 12 scores together (845) and dividing the total by 12.
Example Four (More Challenging)
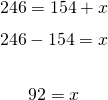
You have two tests with scores of 74 and 80. After the third test, you want to have an average test score of 82. What is the minimum score you need to get on the third test (assuming all the tests are weighted equally)?
It is known that the (desired) average is 82 and the first two test scores are 74 and 80. The third test score is unknown. The formula for the average so far is:

where x is the minimum score needed on the third test to obtain an average of 82.
Multiplying both sides by 3 gives:

We now solve for x.


Summary/Notes
The mode is the number that appears the most often or has the highest count.
The median is the middle number of a sorted list of numbers. If the amount of numbers in the sorted list is odd, the median is the middle number. If the amount of numbers is even, take the total of the two middle numbers and divide that total by 2.
The mean is a weighted average of a list of numbers. It is the total of the values divided by the number of values.
Be very careful when you are making these calculations. It is very easy to make mistakes.
Version two of this post will look at mean, median and mode again but with more detail.
I just took a look at several of your posts. You are producing great educational content! I am part of the @steemiteducation project. I just followed you to make sure I don't miss any of your posts. Thanks for supporting the steemiteducation tag! Hopefully it will continue to grow so we can create a network of teachers helping teachers.
Thank you @hanshotfirst. Steemiteducation is a great project.