Week 1 NFL Daily Fantasy Football Analysis - Positions, Salaries, Projected Point Values, Rankings and More!

I've created a monster --- It...it's ALIVE!!!
Well, I think so anyways. Earlier this summer, I embarked on what I thought would be a four part journey to fine tune an algorithm that used Bayesian Modeling to predict future fantasy football performances. Missed out on those posts? You can read them here: (Part 1, Part 2, and Part 3).
I initially planned on this taking up four parts, but then school started and my busy season took over. I have, however, fired up the algorithm for Week 1 and have my results below! A few things I need to explain first:
- This algorithm uses as its baseline metric performances for a player from 2013-2015. The set of all in game performances are my priors.
- I use Draft Kings scoring to determine historical fantasy points.
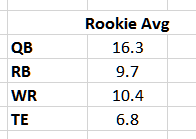
- Because my algorithm MUST have priors on a player, I do not rate rookies for week 1. I do, however have historical rookie performances since 2008 below for your review to help judge new players:
- I use the priors for each player and fit a well known distribution (Gamma Distribution) curve to establish quantiles for that player.
- I use the 75% number as an aggressive estimate for each player.
- I remove outlier points from my data set, and include extra factors, like red zone utilization and targets/touches.
- I account for players that have soft matchups against weak defensive opponents.
- And, most importantly,
THIS IS NOT ADVICE ON WHAT TO DO WITH YOUR MONEY!
I did backtest this algorithm, and had a modest rate of about 58% cashes from the 2015 season. This was mixed across Head to Head and Guaranteed Prize Pool (GPP) tournament structures. This does not mean, however, I endorse you gambling with this information. This is just to be consumed for your statistical entertainment only!
Oh yeah, I also built a lineup optimizer!
The direct link is here, in a shared file through Dropbox. You will need to download and use with Excel on your desktop.
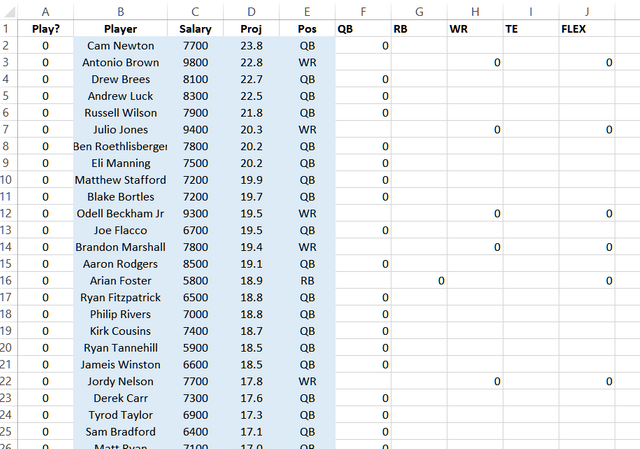
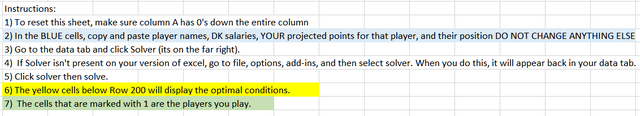
It uses Microsoft Excel's built in Solver feature that will calculate optimal conditions given a certain amount of inputs. Each week I will automatically populate this with my top 200 players, point values, and current Draft Kings salaries.
Feel free though to play around with your own custom players and point values. Just remember to follow the instructions provided on the sheet to use each time!
Now, time for the model! Enjoy!
My top QB's:
| Rank | Player | Pos | Team | Opp | MyModel | Salary | SalaryPerPtPredicted | OppDefRank |
|---|---|---|---|---|---|---|---|---|
| 1 | Cam Newton | QB | CAR | DEN | 23.8 | 7700 | 323.2 | 1 |
| 2 | Drew Brees | QB | NO | OAK | 22.7 | 8100 | 357.1 | 17 |
| 3 | Andrew Luck | QB | IND | DET | 22.5 | 8300 | 368.1 | 19 |
| 4 | Russell Wilson | QB | SEA | MIA | 21.8 | 7900 | 361.8 | 23 |
| 5 | Ben Roethlisberger | QB | PIT | WAS | 20.2 | 7800 | 386.7 | 18 |
| 6 | Eli Manning | QB | NYG | DAL | 20.2 | 7500 | 372.2 | 4 |
| 7 | Matthew Stafford | QB | DET | IND | 19.9 | 7200 | 361.6 | 25 |
| 8 | Blake Bortles | QB | JAX | GB | 19.7 | 7200 | 366.1 | 9 |
| 9 | Joe Flacco | QB | BAL | BUF | 19.5 | 6700 | 343.5 | 15 |
| 10 | Aaron Rodgers | QB | GB | JAX | 19.1 | 8500 | 445.8 | 29 |
| 11 | Ryan Fitzpatrick | QB | NYJ | CIN | 18.8 | 6500 | 345.1 | 13 |
| 12 | Philip Rivers | QB | SD | KC | 18.8 | 7000 | 372.5 | 7 |
| 13 | Kirk Cousins | QB | WAS | PIT | 18.7 | 7400 | 395.0 | 27 |
| 14 | Ryan Tannehill | QB | MIA | SEA | 18.5 | 5900 | 318.9 | 6 |
| 15 | Jameis Winston | QB | TB | ATL | 18.5 | 6600 | 357.6 | 21 |
| 16 | Derek Carr | QB | OAK | NO | 17.6 | 7300 | 414.7 | 32 |
| 17 | Tyrod Taylor | QB | BUF | BAL | 17.3 | 6900 | 398.5 | 20 |
| 18 | Sam Bradford | QB | MIN | TEN | 17.1 | 6400 | 373.9 | 24 |
| 19 | Matt Ryan | QB | ATL | TB | 17.0 | 7100 | 418.0 | 22 |
| 20 | Carson Palmer | QB | ARI | NE | 16.7 | 7100 | 425.5 | 10 |
| 21 | Jay Cutler | QB | CHI | HOU | 16.3 | 6300 | 387.1 | 5 |
| 22 | Alex Smith | QB | KC | SD | 16.1 | 6500 | 404.8 | 11 |
| 23 | Mark Sanchez | QB | DAL | NYG | 15.1 | 5000 | 331.8 | 30 |
| 24 | Andy Dalton | QB | CIN | NYJ | 15.0 | 6800 | 454.6 | 12 |
| 25 | Robert Griffin III | QB | CLE | PHI | 14.8 | 5600 | 377.7 | 31 |
| 26 | Marcus Mariota | QB | TEN | MIN | 13.7 | 6400 | 465.9 | 3 |
| 27 | Case Keenum | QB | LA | SF | 12.5 | 5400 | 431.6 | 26 |
| 28 | Blaine Gabbert | QB | SF | LA | 12.5 | 5200 | 416.6 | 14 |
| 29 | Brock Osweiler | QB | HOU | CHI | 12.0 | 6300 | 523.0 | 16 |
| 30 | Shaun Hill | QB | MIN | TEN | 6.8 | 5000 | 734.9 | 24 |
| 31 | Jimmy Garoppolo | QB | NE | ARI | 3.8 | 6200 | 1618.2 | 2 |
My top RB's:
| Rank | Player | Pos | Team | Opp | MyModel | Salary | SalaryPerPtPredicted | OppDefRank |
|---|---|---|---|---|---|---|---|---|
| 1 | Arian Foster | RB | MIA | SEA | 18.9 | 5800 | 306.2 | 6 |
| 2 | Matt Forte | RB | NYJ | CIN | 16.0 | 6100 | 382.3 | 13 |
| 3 | Adrian Peterson | RB | MIN | TEN | 15.4 | 7600 | 492.4 | 24 |
| 4 | Jamaal Charles | RB | KC | SD | 15.4 | 7100 | 461.6 | 11 |
| 5 | Rashad Jennings | RB | NYG | DAL | 14.9 | 5400 | 362.4 | 4 |
| 6 | Devonta Freeman | RB | ATL | TB | 13.7 | 6900 | 503.4 | 22 |
| 7 | Mark Ingram | RB | NO | OAK | 13.2 | 6600 | 498.9 | 17 |
| 8 | Todd Gurley | RB | LA | SF | 13.0 | 7800 | 600.9 | 26 |
| 9 | LeSean McCoy | RB | BUF | BAL | 12.7 | 6400 | 502.5 | 20 |
| 10 | Lamar Miller | RB | HOU | CHI | 12.7 | 7000 | 550.0 | 16 |
| 11 | David Johnson | RB | ARI | NE | 12.6 | 7500 | 595.2 | 10 |
| 12 | Tim Hightower | RB | NO | OAK | 12.5 | 4300 | 342.7 | 17 |
| 13 | Eddie Lacy | RB | GB | JAX | 11.8 | 6700 | 569.4 | 29 |
| 14 | Frank Gore | RB | IND | DET | 11.7 | 5500 | 470.2 | 19 |
| 15 | Danny Woodhead | RB | SD | KC | 11.6 | 5000 | 429.8 | 7 |
| 16 | Darren McFadden | RB | DAL | NYG | 11.3 | 4200 | 371.2 | 30 |
| 17 | Alfred Morris | RB | DAL | NYG | 11.2 | 3800 | 340.6 | 30 |
| 18 | DeMarco Murray | RB | TEN | MIN | 11.0 | 5300 | 481.1 | 3 |
| 19 | DeAngelo Williams | RB | PIT | WAS | 10.9 | 7000 | 641.1 | 18 |
| 20 | Latavius Murray | RB | OAK | NO | 10.9 | 5600 | 515.9 | 32 |
| 21 | Isaiah Crowell | RB | CLE | PHI | 10.8 | 4200 | 387.8 | 31 |
| 22 | Doug Martin | RB | TB | ATL | 10.7 | 6200 | 581.7 | 21 |
| 23 | Thomas Rawls | RB | SEA | MIA | 10.4 | 6000 | 575.0 | 23 |
| 24 | TJ Yeldon | RB | JAX | GB | 10.3 | 4100 | 399.3 | 9 |
| 25 | Jeremy Hill | RB | CIN | NYJ | 9.9 | 4600 | 464.3 | 12 |
| 26 | Charles Sims | RB | TB | ATL | 9.9 | 4400 | 444.9 | 21 |
| 27 | Bilal Powell | RB | NYJ | CIN | 9.8 | 4300 | 437.8 | 13 |
| 28 | Darren Sproles | RB | PHI | CLE | 9.7 | 4200 | 434.9 | 28 |
| 29 | Ronnie Hillman | RB | DEN | CAR | 9.5 | 3000 | 316.0 | 8 |
| 30 | Shane Vereen | RB | NYG | DAL | 9.4 | 3800 | 404.7 | 4 |
| 31 | Giovani Bernard | RB | CIN | NYJ | 9.3 | 4800 | 515.2 | 12 |
| 32 | Duke Johnson | RB | CLE | PHI | 9.3 | 5100 | 549.4 | 31 |
| 33 | Javorius Allen | RB | BAL | BUF | 9.0 | 3600 | 400.3 | 15 |
| 34 | Jonathan Stewart | RB | CAR | DEN | 8.9 | 5100 | 572.2 | 1 |
| 35 | Charcandrick West | RB | KC | SD | 8.4 | 3500 | 417.3 | 11 |
| 36 | James Starks | RB | GB | JAX | 8.3 | 4800 | 578.5 | 29 |
| 37 | Theo Riddick | RB | DET | IND | 8.2 | 4000 | 486.7 | 25 |
| 38 | CJ Anderson | RB | DEN | CAR | 8.0 | 5900 | 741.2 | 8 |
| 39 | Chris Ivory | RB | JAX | GB | 7.8 | 4300 | 550.7 | 9 |
| 40 | Chris Johnson | RB | ARI | NE | 7.5 | 3700 | 492.0 | 10 |
| 41 | Alfred Blue | RB | HOU | CHI | 7.5 | 3600 | 479.2 | 16 |
| 42 | Ameer Abdullah | RB | DET | IND | 7.0 | 4900 | 701.5 | 25 |
| 43 | Andre Ellington | RB | ARI | NE | 6.9 | 4100 | 593.3 | 10 |
| 44 | Jerick McKinnon | RB | MIN | TEN | 6.8 | 4600 | 672.5 | 24 |
| 45 | Ryan Mathews | RB | PHI | CLE | 6.8 | 5700 | 834.2 | 28 |
| 46 | Spencer Ware | RB | KC | SD | 6.8 | 4400 | 645.1 | 11 |
| 47 | James White | RB | NE | ARI | 6.6 | 3600 | 544.9 | 2 |
| 48 | Melvin Gordon | RB | SD | KC | 6.6 | 4600 | 701.4 | 7 |
| 49 | Matt Jones | RB | WAS | PIT | 6.4 | 4700 | 740.1 | 27 |
| 50 | CJ Spiller | RB | NO | OAK | 6.1 | 3600 | 593.4 | 17 |
| 51 | Benjamin Cunningham | RB | LA | SF | 6.0 | 3700 | 614.2 | 26 |
| 52 | Cameron Artis-Payne | RB | CAR | DEN | 5.9 | 3000 | 505.8 | 1 |
| 53 | Shaun Draughn | RB | SF | LA | 5.5 | 3700 | 672.4 | 14 |
| 54 | Tevin Coleman | RB | ATL | TB | 5.3 | 4200 | 790.9 | 22 |
| 55 | Carlos Hyde | RB | SF | LA | 5.2 | 5600 | 1069.3 | 14 |
| 56 | Terrance West | RB | BAL | BUF | 5.2 | 4100 | 787.3 | 15 |
| 57 | Chris Thompson | RB | WAS | PIT | 4.9 | 4000 | 814.6 | 27 |
| 58 | Jeremy Langford | RB | CHI | HOU | 4.8 | 4700 | 971.7 | 5 |
| 59 | LeGarrette Blount | RB | NE | ARI | 4.7 | 3700 | 785.9 | 2 |
| 60 | Christine Michael | RB | SEA | MIA | 4.1 | 3700 | 912.5 | 23 |
| 61 | Robert Turbin | RB | IND | DET | 3.2 | 3000 | 923.8 | 19 |
| 62 | Jay Ajayi | RB | MIA | SEA | 3.0 | 4200 | 1423.7 | 6 |
My Top WR's:
| Rank | Player | Pos | Team | Opp | MyModel | Salary | SalaryPerPtPredicted | OppDefRank |
|---|---|---|---|---|---|---|---|---|
| 1 | Antonio Brown | WR | PIT | WAS | 22.8 | 9800 | 429.1 | 18 |
| 2 | Julio Jones | WR | ATL | TB | 20.3 | 9400 | 462.1 | 22 |
| 3 | Odell Beckham Jr | WR | NYG | DAL | 19.5 | 9300 | 476.0 | 4 |
| 4 | Brandon Marshall | WR | NYJ | CIN | 19.4 | 7800 | 402.2 | 13 |
| 5 | Jordy Nelson | WR | GB | JAX | 17.8 | 7700 | 433.0 | 29 |
| 6 | Demaryius Thomas | WR | DEN | CAR | 16.3 | 7000 | 428.8 | 8 |
| 7 | Sammy Watkins | WR | BUF | BAL | 16.0 | 6900 | 430.3 | 20 |
| 8 | DeAndre Hopkins | WR | HOU | CHI | 15.1 | 8800 | 584.5 | 16 |
| 9 | Jordan Matthews | WR | PHI | CLE | 15.0 | 6700 | 445.6 | 28 |
| 10 | Emmanuel Sanders | WR | DEN | CAR | 14.4 | 5700 | 395.9 | 8 |
| 11 | Doug Baldwin | WR | SEA | MIA | 14.2 | 6600 | 463.9 | 23 |
| 12 | Mike Evans | WR | TB | ATL | 14.0 | 7400 | 527.4 | 21 |
| 13 | AJ Green | WR | CIN | NYJ | 14.0 | 8400 | 601.6 | 12 |
| 14 | Golden Tate | WR | DET | IND | 13.6 | 7300 | 538.5 | 25 |
| 15 | Brandin Cooks | WR | NO | OAK | 13.4 | 7700 | 574.4 | 17 |
| 16 | Eric Decker | WR | NYJ | CIN | 13.3 | 6600 | 495.0 | 13 |
| 17 | Keenan Allen | WR | SD | KC | 13.3 | 8000 | 602.2 | 7 |
| 18 | Jeremy Maclin | WR | KC | SD | 13.3 | 6500 | 490.1 | 11 |
| 19 | Randall Cobb | WR | GB | JAX | 13.2 | 7600 | 575.8 | 29 |
| 20 | TY Hilton | WR | IND | DET | 12.5 | 7500 | 598.7 | 19 |
| 21 | Allen Robinson | WR | JAX | GB | 12.5 | 8300 | 664.2 | 9 |
| 22 | Jarvis Landry | WR | MIA | SEA | 12.3 | 6000 | 486.0 | 6 |
| 23 | Dez Bryant | WR | DAL | NYG | 12.1 | 8500 | 704.1 | 30 |
| 24 | Steve Smith | WR | BAL | BUF | 12.1 | 4900 | 406.3 | 15 |
| 25 | Amari Cooper | WR | OAK | NO | 12.1 | 7200 | 597.4 | 32 |
| 26 | Alshon Jeffery | WR | CHI | HOU | 12.0 | 7900 | 656.6 | 5 |
| 27 | Allen Hurns | WR | JAX | GB | 11.8 | 5800 | 490.7 | 9 |
| 28 | Anquan Boldin | WR | DET | IND | 11.5 | 4500 | 391.2 | 25 |
| 29 | Michael Crabtree | WR | OAK | NO | 11.5 | 5500 | 478.9 | 32 |
| 30 | Julian Edelman | WR | NE | ARI | 11.4 | 6100 | 533.0 | 2 |
| 31 | Terrance Williams | WR | DAL | NYG | 11.2 | 3300 | 293.9 | 30 |
| 32 | Larry Fitzgerald | WR | ARI | NE | 11.2 | 6300 | 561.8 | 10 |
| 33 | Michael Floyd | WR | ARI | NE | 11.0 | 5900 | 538.3 | 10 |
| 34 | Pierre Garcon | WR | WAS | PIT | 10.6 | 4400 | 413.2 | 27 |
| 35 | DeSean Jackson | WR | WAS | PIT | 10.6 | 6100 | 576.3 | 27 |
| 36 | John Brown | WR | ARI | NE | 10.5 | 5200 | 493.1 | 10 |
| 37 | Kamar Aiken | WR | BAL | BUF | 10.5 | 4700 | 448.4 | 15 |
| 38 | Dorial Green-Beckham | WR | PHI | CLE | 10.3 | 4500 | 437.9 | 28 |
| 39 | Markus Wheaton | WR | PIT | WAS | 10.1 | 5400 | 534.9 | 18 |
| 40 | Tavon Austin | WR | LA | SF | 10.1 | 5000 | 495.3 | 26 |
| 41 | Cecil Shorts | WR | HOU | CHI | 10.0 | 3300 | 330.4 | 16 |
| 42 | Jermaine Kearse | WR | SEA | MIA | 9.9 | 3500 | 351.9 | 23 |
| 43 | Tyler Lockett | WR | SEA | MIA | 9.8 | 5000 | 509.4 | 23 |
| 44 | Cole Beasley | WR | DAL | NYG | 9.8 | 3200 | 326.8 | 30 |
| 45 | Robert Woods | WR | BUF | BAL | 9.6 | 4600 | 477.4 | 20 |
| 46 | Willie Snead | WR | NO | OAK | 9.6 | 4800 | 499.6 | 17 |
| 47 | Andrew Hawkins | WR | CLE | PHI | 9.5 | 3800 | 398.1 | 31 |
| 48 | Ted Ginn | WR | CAR | DEN | 9.4 | 4100 | 434.5 | 1 |
| 49 | Kenny Britt | WR | LA | SF | 9.4 | 3900 | 416.5 | 26 |
| 50 | Kelvin Benjamin | WR | CAR | DEN | 9.3 | 5700 | 613.6 | 1 |
| 51 | Vincent Jackson | WR | TB | ATL | 9.2 | 4400 | 480.8 | 21 |
| 52 | Marvin Jones | WR | DET | IND | 9.1 | 4600 | 506.4 | 25 |
| 53 | Torrey Smith | WR | SF | LA | 8.8 | 4900 | 557.5 | 14 |
| 54 | Stefon Diggs | WR | MIN | TEN | 8.7 | 4800 | 554.7 | 24 |
| 55 | Victor Cruz | WR | NYG | DAL | 8.6 | 4000 | 464.7 | 4 |
| 56 | Brandon LaFell | WR | CIN | NYJ | 8.6 | 3900 | 455.1 | 12 |
| 57 | Andre Johnson | WR | TEN | MIN | 8.5 | 3900 | 459.5 | 3 |
| 58 | Mike Wallace | WR | BAL | BUF | 8.4 | 4200 | 497.3 | 15 |
| 59 | Travis Benjamin | WR | SD | KC | 8.3 | 4100 | 496.3 | 7 |
| 60 | Devante Parker | WR | MIA | SEA | 8.2 | 5300 | 648.6 | 6 |
| 61 | Seth Roberts | WR | OAK | NO | 8.1 | 3800 | 466.3 | 32 |
| 62 | Jamison Crowder | WR | WAS | PIT | 8.1 | 3800 | 468.0 | 27 |
| 63 | Davante Adams | WR | GB | JAX | 7.9 | 4300 | 543.9 | 29 |
| 64 | Brandon Coleman | WR | NO | OAK | 7.8 | 3000 | 382.5 | 17 |
| 65 | Dontrelle Inman | WR | SD | KC | 7.8 | 3400 | 433.9 | 7 |
| 66 | Eddie Royal | WR | CHI | HOU | 7.6 | 3200 | 419.4 | 5 |
| 67 | Rishard Matthews | WR | TEN | MIN | 7.6 | 3300 | 435.3 | 3 |
| 68 | Mohamed Sanu | WR | ATL | TB | 7.4 | 5100 | 687.3 | 22 |
| 69 | Brice Butler | WR | DAL | NYG | 7.3 | 3000 | 412.0 | 30 |
| 70 | Devin Funchess | WR | CAR | DEN | 7.3 | 4800 | 660.5 | 1 |
| 71 | Andre Holmes | WR | OAK | NO | 7.0 | 3200 | 459.8 | 32 |
| 72 | Nelson Agholor | WR | PHI | CLE | 6.9 | 3500 | 506.6 | 28 |
| 73 | Marquess Wilson | WR | CHI | HOU | 6.8 | 3700 | 542.7 | 5 |
| 74 | JJ Nelson | WR | ARI | NE | 6.4 | 3200 | 501.4 | 10 |
| 75 | Donte Moncrief | WR | IND | DET | 6.3 | 6000 | 951.6 | 19 |
| 76 | Albert Wilson | WR | KC | SD | 6.3 | 3600 | 574.2 | 11 |
| 77 | Kendall Wright | WR | TEN | MIN | 6.2 | 3400 | 548.2 | 3 |
| 78 | Danny Amendola | WR | NE | ARI | 6.2 | 4200 | 679.6 | 2 |
| 79 | Jaelen Strong | WR | HOU | CHI | 6.0 | 3800 | 628.4 | 16 |
| 80 | Corey Brown | WR | CAR | DEN | 6.0 | 3000 | 501.3 | 1 |
| 81 | Justin Hardy | WR | ATL | TB | 5.9 | 3100 | 529.8 | 22 |
| 82 | Marqise Lee | WR | JAX | GB | 5.6 | 3100 | 549.0 | 9 |
| 83 | Jarius Wright | WR | MIN | TEN | 5.4 | 3000 | 558.2 | 24 |
| 84 | Kenny Stills | WR | MIA | SEA | 5.3 | 3200 | 602.6 | 6 |
| 85 | Paul Richardson | WR | SEA | MIA | 5.2 | 3000 | 577.9 | 23 |
| 86 | Quinton Patton | WR | SF | LA | 5.0 | 4000 | 793.0 | 14 |
| 87 | Quincy Enunwa | WR | NYJ | CIN | 4.8 | 3800 | 788.3 | 13 |
| 88 | Phillip Dorsett | WR | IND | DET | 4.8 | 4500 | 945.5 | 19 |
| 89 | Jeremy Kerley | WR | SF | LA | 4.6 | 3000 | 655.8 | 14 |
| 90 | Chris Hogan | WR | NE | ARI | 4.6 | 3600 | 789.2 | 2 |
| 91 | Dwayne Harris | WR | NYG | DAL | 4.5 | 3600 | 800.5 | 4 |
| 92 | Chris Conley | WR | KC | SD | 4.5 | 3700 | 828.3 | 11 |
| 93 | TJ Jones | WR | DET | IND | 4.3 | 3000 | 692.4 | 25 |
| 94 | Rashad Greene | WR | JAX | GB | 4.0 | 3500 | 865.6 | 9 |
| 95 | Charles Johnson | WR | MIN | TEN | 3.8 | 3000 | 781.3 | 24 |
| 96 | Bennie Fowler | WR | DEN | CAR | 2.1 | 3000 | 1415.6 | 8 |
My Top TE's:
| Rank | Player | Pos | Team | Opp | MyModel | Salary | SalaryPerPtPredicted | OppDefRank |
|---|---|---|---|---|---|---|---|---|
| 1 | Zach Ertz | TE | PHI | CLE | 14.4 | 4300 | 299.0 | 28 |
| 2 | Jordan Reed | TE | WAS | PIT | 13.1 | 6600 | 505.7 | 27 |
| 3 | Delanie Walker | TE | TEN | MIN | 12.8 | 4500 | 352.0 | 3 |
| 4 | Rob Gronkowski | TE | NE | ARI | 12.3 | 7400 | 602.8 | 2 |
| 5 | Gary Barnidge | TE | CLE | PHI | 11.2 | 4700 | 420.3 | 31 |
| 6 | Jason Witten | TE | DAL | NYG | 11.0 | 4100 | 372.3 | 30 |
| 7 | Jimmy Graham | TE | SEA | MIA | 10.8 | 3800 | 351.1 | 23 |
| 8 | Greg Olsen | TE | CAR | DEN | 10.6 | 5100 | 483.3 | 1 |
| 9 | Antonio Gates | TE | SD | KC | 10.3 | 4200 | 407.7 | 7 |
| 10 | Julius Thomas | TE | JAX | GB | 8.6 | 3800 | 443.7 | 9 |
| 11 | Martellus Bennett | TE | NE | ARI | 8.5 | 3400 | 398.1 | 2 |
| 12 | Coby Fleener | TE | NO | OAK | 8.1 | 4900 | 604.9 | 17 |
| 13 | Travis Kelce | TE | KC | SD | 8.0 | 5000 | 623.3 | 11 |
| 14 | Kyle Rudolph | TE | MIN | TEN | 8.0 | 3000 | 376.2 | 24 |
| 15 | Eric Ebron | TE | DET | IND | 8.0 | 3900 | 490.1 | 25 |
| 16 | Richard Rodgers | TE | GB | JAX | 7.3 | 3100 | 423.4 | 29 |
| 17 | Charles Clay | TE | BUF | BAL | 7.3 | 3400 | 467.9 | 20 |
| 18 | Will Tye | TE | NYG | DAL | 7.1 | 3300 | 465.1 | 4 |
| 19 | Jared Cook | TE | GB | JAX | 6.7 | 2900 | 429.8 | 29 |
| 20 | Lance Kendricks | TE | LA | SF | 6.7 | 3200 | 476.3 | 26 |
| 21 | Mychal Rivera | TE | OAK | NO | 6.7 | 2600 | 390.2 | 32 |
| 22 | Zach Miller | TE | CHI | HOU | 6.5 | 3700 | 565.3 | 5 |
| 23 | Larry Donnell | TE | NYG | DAL | 6.4 | 2900 | 456.1 | 4 |
| 24 | Austin Seferian-Jenkins | TE | TB | ATL | 6.2 | 2800 | 454.2 | 21 |
| 25 | Crockett Gillmore | TE | BAL | BUF | 5.8 | 2600 | 450.1 | 15 |
| 26 | Dennis Pitta | TE | BAL | BUF | 5.7 | 2600 | 459.4 | 15 |
| 27 | Dwayne Allen | TE | IND | DET | 5.2 | 3200 | 610.2 | 19 |
| 28 | Maxx Williams | TE | BAL | BUF | 5.2 | 2600 | 502.3 | 15 |
| 29 | Brent Celek | TE | PHI | CLE | 5.2 | 2700 | 522.5 | 28 |
| 30 | Vance McDonald | TE | SF | LA | 5.1 | 3100 | 604.5 | 14 |
| 31 | Jacob Tamme | TE | ATL | TB | 5.1 | 2800 | 549.5 | 22 |
| 32 | Clive Walford | TE | OAK | NO | 4.9 | 3000 | 606.6 | 32 |
| 33 | Tyler Kroft | TE | CIN | NYJ | 4.7 | 2700 | 572.9 | 12 |
| 34 | Darren Fells | TE | ARI | NE | 4.6 | 2700 | 581.6 | 10 |
| 35 | Luke Willson | TE | SEA | MIA | 4.4 | 2700 | 610.1 | 23 |
| 36 | Jordan Cameron | TE | MIA | SEA | 4.4 | 3000 | 683.5 | 6 |
| 37 | Jack Doyle | TE | IND | DET | 3.9 | 2500 | 635.5 | 19 |
| 38 | Garrett Celek | TE | SF | LA | 3.8 | 2700 | 704.0 | 14 |
| 39 | Ryan Griffin | TE | HOU | CHI | 3.8 | 2600 | 681.8 | 16 |
| 40 | Jace Amaro | TE | TEN | MIN | 3.7 | 2700 | 730.3 | 3 |
| 41 | Cameron Brate | TE | TB | ATL | 3.6 | 2900 | 815.3 | 21 |
| 42 | Josh Hill | TE | NO | OAK | 3.5 | 2500 | 704.6 | 17 |
| 43 | Dion Sims | TE | MIA | SEA | 3.4 | 2500 | 730.8 | 6 |
| 44 | Jesse James | TE | PIT | WAS | 2.5 | 3400 | 1361.6 | 18 |
| 45 | Virgil Green | TE | DEN | CAR | 2.3 | 2900 | 1286.1 | 8 |
| 46 | Ryan Hewitt | TE | CIN | NYJ | 2.2 | 2500 | 1118.0 | 12 |
My Top DST's
Note, these are organized by top percentile performances over a rolling average of the past eight games. Their overall percentile is also displayed, the higher, the better.
| Rank | Team | Percentile |
|---|---|---|
| 1 | DEN | 0.975 |
| 2 | ARI | 0.917 |
| 3 | MIN | 0.894 |
| 4 | DAL | 0.854 |
| 5 | HOU | 0.849 |
| 6 | SEA | 0.842 |
| 7 | KC | 0.831 |
| 8 | CAR | 0.806 |
| 9 | GB | 0.805 |
| 10 | NE | 0.758 |
| 11 | SD | 0.722 |
| 12 | NYJ | 0.722 |
| 13 | CIN | 0.633 |
| 14 | LA | 0.620 |
| 15 | BUF | 0.603 |
| 16 | CHI | 0.532 |
| 17 | OAK | 0.486 |
| 18 | WAS | 0.468 |
| 19 | DET | 0.427 |
| 20 | BAL | 0.407 |
| 21 | ATL | 0.391 |
| 22 | TB | 0.379 |
| 23 | MIA | 0.372 |
| 24 | TEN | 0.316 |
| 25 | IND | 0.290 |
| 26 | SF | 0.158 |
| 27 | PIT | 0.139 |
| 28 | CLE | 0.122 |
| 29 | JAX | 0.075 |
| 30 | NYG | 0.036 |
| 31 | PHI | 0.026 |
| 32 | NO | 0.021 |

Very cool stuff. It's a bit off for this week given some injury issues, aging players that aren't as good as they once were, and changing situations, imagine it works really well later in a season for guys who started all season long, but awesome work.
Thanks for the kind words! In backtesting, what you described is exactly what played out. My most profitable weeks were 11-15.
I thought I would include the the optimizer in these posts so people could adjust point values accordingly. I have already marked out a few injuries and non-starters, and am going to slide around a few more for old age and risky plays. Generally speaking though, I'm pretty happy with where it landed so far for the first week!
I'm going to go very low risk this week and go majority h2h comps until I get more data, for sure.
wow awesome! so glad to see the DFS scene active here! Looking forward to seeing all the cool stuff that's gonna show up on steemit over the course of the season!
Also, in my mock draft today I got Cam and Forte and everything felt happy.
I LOVE Forte this year! I actually believe the Jets will seriously have some real firepower this year. Between him, Marshall, and Decker, I like where they are headed!
Ya im really hoping he crushes. Still weird seeing him on the Jets tho but should hopefully be a good fit for him.
do you think you could use machine learning to drive insights from these numbers?
You know, that is very interesting to consider. Admittedly, setting up that kind of environment would be a little bit out of my current expertise, but with what I understand about the area I believe it could be done. Knowing what I know about DFS, I'd actually be shocked if people aren't already implementing this in more sophisticated algorithms than my own.
Really, Zach Ertz is your top TE?
For Week 1? Yes. I think considering the matchup against the #28 DST and historical point values this seems reasonable. If he has a stinker of a performance, or red zone targets go down he goes down the rankings. All a fun experiment at this point!
I suppose with a rookie QB he could be getting a lot of extra targets.