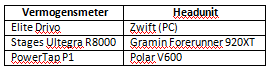
PowerTap P1 / Stages Ultegra R8000 / Elite Drivo
Promised is promised.
In the PowerTap P1 and Stages Ultegra review I promised a detailed comparison with the Elite Drivo, and hereby I deliver.
Allow me, for this interested, to explain the way I tackled this comparison. Each powermeter was paired with a different headunit, as you can see in the table hereunder. Measurements were started simultaneously and a one hour Zwift session was completed the collect sufficient data.
To start sessions simultaneously, isn't that nearly impossible? Indeed it is, but no worries. In order to align the different graphs I coasted during seconds 100 to 110, followed by a surge, followed by another coast from seconds 130 to 140. This structure is recognizable is all graphs and will easily allow alignment.
In the Zwift session I tried to adopt different styles of riding, in order to make the comparison as complete as possible. The session itself took place in London. I started via Pimlico, sprinted at Buckingham Palace, climbed up Box Hill and ended with a climb on Keith Hill. Sessions details can be found here.
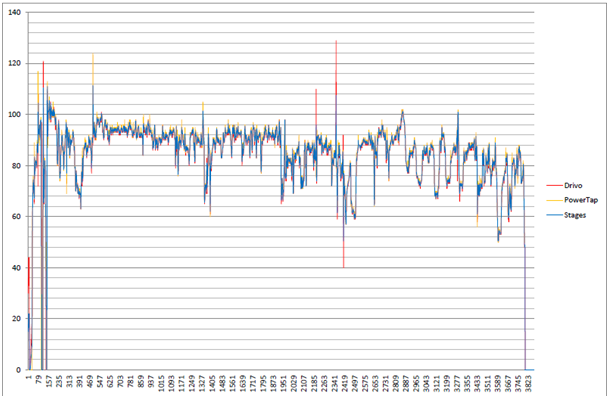
The first graph I introduce is the one that matters: Power!
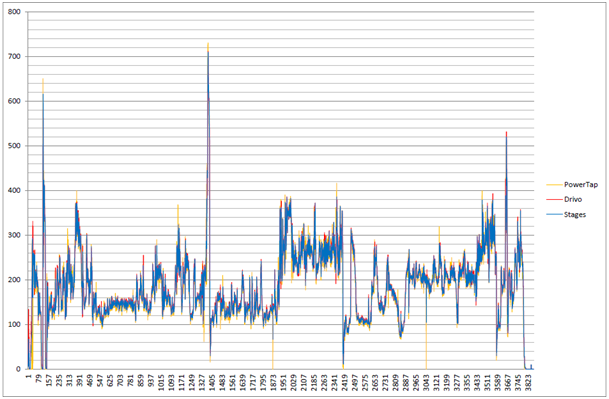
Power ifo Time (per second)
This graph contains all datapoint I extracted from the TCX files using Golden Cheetah and is, as such, unusable. To not see the forest through the trees it's called. The next step will be, using our beloved Excel, to simplify this graph using rolling averages, giving a '10s average' graph of all three meters.
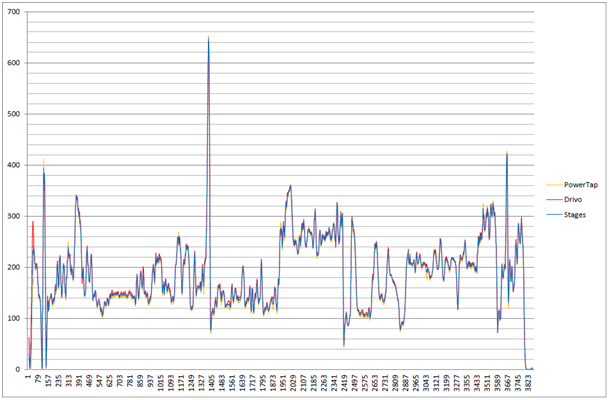
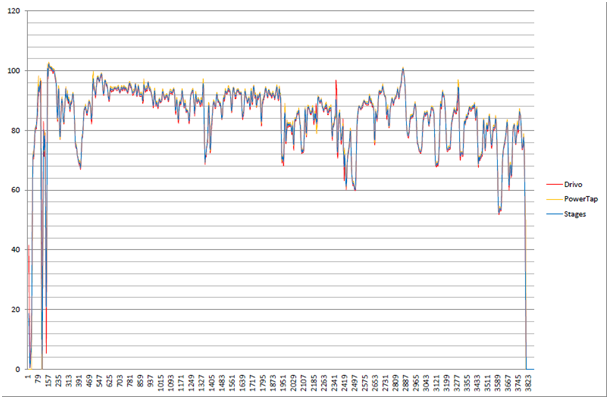
Power ifo Time (per 10 seconds)
Much clearer.
Now lets look into details at each of the different segments in order to compare the different meters.
Sprint
(to get enough data on screen I had to pivot the graph, cut me some slack)
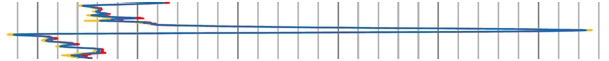
During the built we can see the PowerTap and Stages slightly, if not neglectfully, respond a bit slower than the Drivo. After the print the phenomenon is exactly inverse. Most important is the peak. Slight differences are measured among the different meters. The PowerTap came with 730W, followed by the Drivo at 711W and lastly the Stages with 709W. A maximum difference of 2,9%. Both powermeters claimed a 1,5% accuracy (= 3%) so we are just within limits.
Climb Box Hill
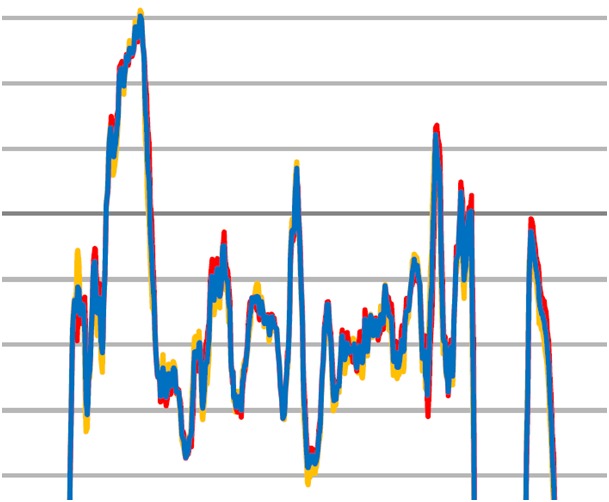
The same statement can be made here. Besides a slight retardation in measurement (which might be caused by not 100% alignment) the peaks are virtually identical. Info: the gray lines are 20W each. The most remarkable aspect of this graph is that the extremes are more accentuated with the PowerTap: the peaks are higher and the lows are lower.
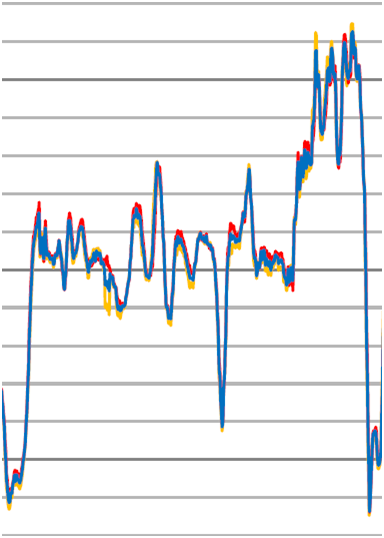
In and out
The pressure created on Box Hill seemed to influence the meters. On the descent after the climb, the FE-C mode of the Drivo releases the brake completely, making the measurements differ for an extended period of time. Once a new peak is introduced, data converges once more, possibly due to the Drivo drive motor.
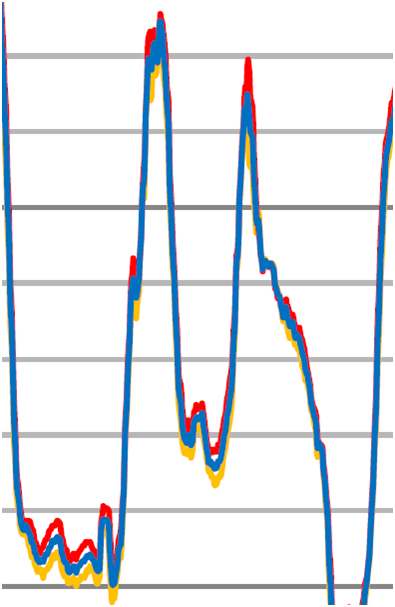
Climb Keith Hill
What we have seen before seems to be confirmed on the second climb. There is a slight shift in data, but the peaks are aligned. In general we can say all three meters deliver the same correct or false data.
The next question is this claimed 1,5% accuracy. This is something we can't really confirm with our home-made setup, since none of our meters is scientifically tested. To be as complete as possible, I performed the comparison, using the Drivo as benchmark since this one is not dependent of batteries and will, intuitively deliver the most accurate data. The comparing graph looks as follows.
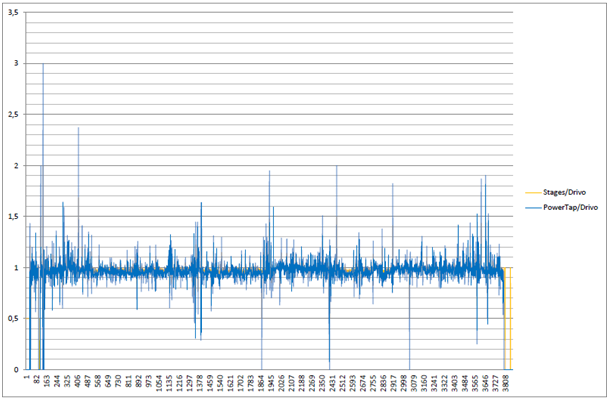
Relative Power compared to Drivo ifo Time (per second)
A '10s average' graph looks as follows (I added the overall average as well).
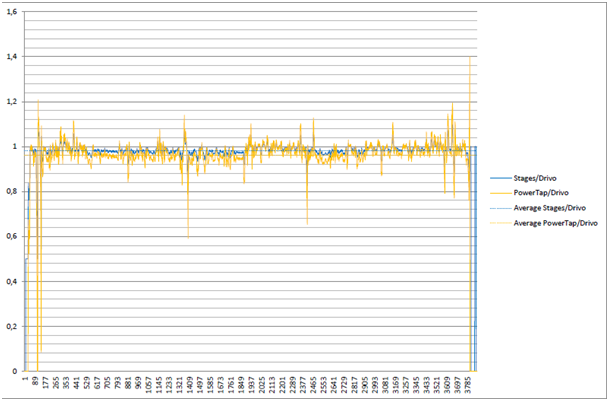
Relative Power compared to Drivo ifo Time (per 10 seconds)
We notice that the PowerTap values are consistently lower than the Drivo, about 4% to be exact. This means that one of the two is lying about its 1,5% accuracy. Who is up for guessing. Stages is about 2% lower than the Drivo on average, neatly within this 3% margin.
But the meters show more than just power! There is cadans. Since this does not use complex mechanics and algorithms (at least for the Stages and the PowerTap), we can expect these graphs to be identical.
Behold! The complete graph.
Cadans ifo Time (per second)
And the '10s average' graph.
Cadans ifo Time (per 10 seconds)
Beautiful these matching graphs.
The only outlier is caused by the Drivo. No illogical if you have to distill cadans from... god knows what... I haven't entered my gear-ratio, so I have no clue on what this cadans is based. Maybe the number of 'pulls' per minute caused by pedaling. Who will tell...
So in a nutshell: Are the PowerTap P1 and Stages Ultegra R8000 reliable on data output? I do think so. If you take into account that the PowerTap is (consistently) on the low side, you can easily include this deficit in your trainingzones.
https://www.youtube.com/paulbegley34