S&P 500 update 20.06.18
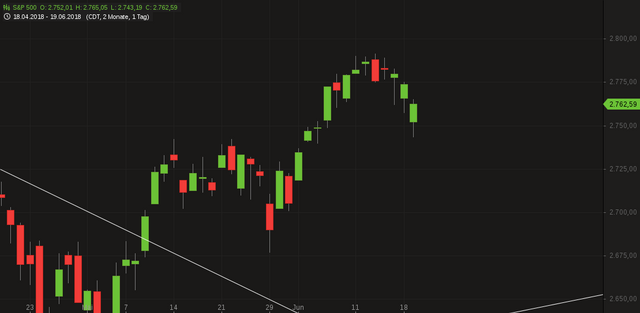
Can you spot something very strange, when you look at the S&P500 chart?
I am talking about theese three green daily candles...
We are seeing lower lows, but the candles close all in green and even near the high of that day? What does that mean?
It means this is a necessary correction, but every new low is instantly bought by the big money. Because they know whats coming...
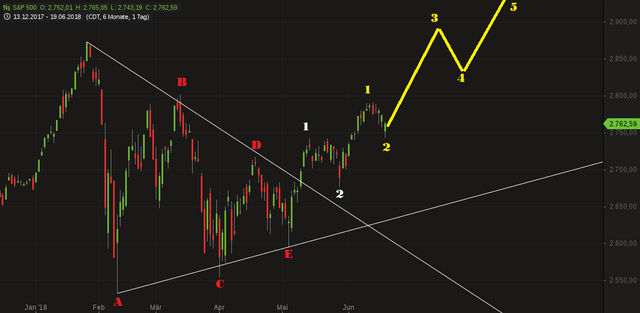
You may have guessed it right now, I am long S&P500 as well. Here is why:
No matter how you count this... the outcome is always bullish. I am not saying this is a 100% trade, but it is a very high probability trade in my opinion. It's an easy long trade for me... You can place the stop below yellow wave 2 with a very good risk reward ratio of 10.5:1 (for reaching the target of yellow wave 5).
You may be asking why is yellow wave 3 so big? Well it is just a normal 162% extension of yellow wave 1. The fact that yellow wave 1 was so big, gives this a high probability of being even bigger.
.png)
If you think this to be useful information:

.png)
Feel free to use and share my charts, but please mention me, @ew-and-patterns as the author. Otherwise it is considered plagiarism and I will flag you and advise my friends to do the same.
.png)
MUST READ!
DISCLAIMER: This post / analysis serves general information purposes only. I am not, and never will be a financial adviser. The material in this post does not constitute any trading advice whatsoever. This is just the way I see the charts and what my trading ideas (from my personal experiences) are. I use chart pattern and Elliott Wave analysis for my trading ideas.
For full disclosure: The author of this post is holding positions in this market at the time of this post. Please conduct your own due diligence, if you plan to copy anyones investment decisions!
If you make any trades or investments after reading this post, it is completely in your own responsibility. I am not responsible for any of your losses. By reading this post you acknowledge and accept to never hold me accountable for any of your losses.
Please consider leaving a comment, like or resteem, if this post entertained you or helped you see things differently...
Have a nice day :-)
.png)
#crypto #cryptocurrency #steem #sbd #bitcoin #btc #bch #eos #ethereum #eth #litecoin #ltc #ripple #xrp #stellar #xlm #nano #cardano #ada #vechain #digibyte #dgb #binance #tron #trx #iota #neo #xmr #dash #omg #verge #xvg #bitshares #bts #finance #money #investing
.png)


Upvote this blog post. https://steemit.com/christianity/@bible.com/verse-of-the-day-hebrews-4-16-nlt
so mean some guys with huge money are fighting with this dump?
they pushed it down in the morning to buy back lower in the evening. This will likely result in the continuation of the uptrend soon.
So they are making an instant profit and also testing the market. hopefully, it will happen and we will start feeling uptrend.
So far I understand, but I am a NOB in this, is it useful for our steemit price?
Unfortunately not^^.
Thanks for the analysis. Take a look at EEM, its also an interesting chart from an EW perspective.
I would like to ask your permission to translate your post into Indonesian