HD Tune Pro hard disk utility portable version
HD Tune Pro is a hard disk utility which has the following functions:
• Benchmark: measures the low-level performance (read/write)
• File Benchmark: measures the file performance (read/write)
• Random Access: measures the random access performance (read/write)
• Extra Tests: includes several quick tests to show the most important performance
parameters (read/write)
• Cache Test
• Info: shows detailed information
• Health: checks the health status by using SMART, data can be logged
• Error Scan: scans the surface for errors
• Erase: securely erases all data from the disk
• Disk Monitor: monitors disk access
• Folder View: shows disk space usage for each folder
• AAM: reduces noise or increases seek performance
• Temperature display
1.Benchmark
The benchmark function offers four different tests:
Transfer rate
The data transfer rate is measured across the entire disk surface (default) or across the
selected capacity (short stroke option).
The X-axis shows the position in gigabytes (GB). The Y-axis shows the transfer speed in
megabytes per second (MB/s).
Both read and write transfer rate can be measured. To prevent accidental data loss, the write
test can only be performed on a disk with no partitions.
2.File benchmark
The file benchmark measures the performance for reading and writing files to the selected
hard disk partition with different block sizes ranging from 0.5 KB to 8192 KB (x-axis).
The length of the test files can be set. For accurate results a large size is recommended. If the
file length is too small the hard disk may be able to cache the entire file. In that case the cache
speed will be measured instead of the hard disk throughput.
On some configurations it may be necessary to add a delay between the write and read test
to make sure all data is written to the disk before the read test is executed.
This test is non-destructive but requires a partition with a drive letter associated
3.Random access
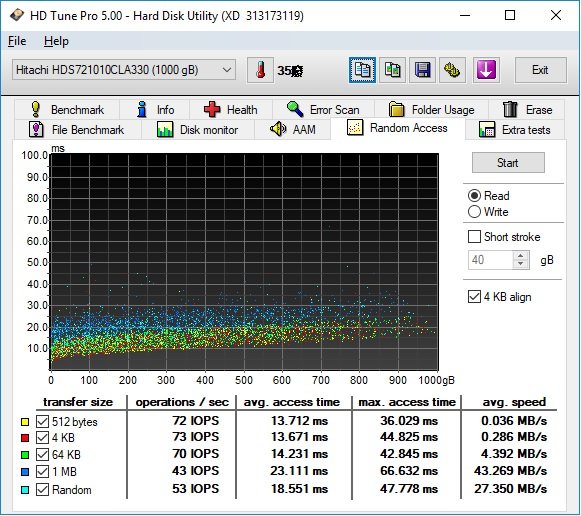
The Random Access test measures the performance of random read or write operations.
The amount of data which will be read varies from 512 bytes to 1 MB.
The random test uses transfer size between 512 bytes and 1 MB.
You can choose which tests will be performed by clicking on the checkboxes next to the
transfer size.
Results are shown in three different units:
Operations per seconds (IOPS): number of completed read or write requests per second.
Higher is better.
Avg. access time (in milliseconds or ms): average amount of time it takes to perform a single
read or write operation. Lower is better.
Avg. speed (in megabytes per second or MB/s): average transfer speed for a completed read
or write operation. Higher is better.
This test is a low level test and can only be performed on a drive with no partitions (see the
benchmark topic for more information).
The random access performance can be measured on a partial section of the hard drive by
setting the short stroke options.
4.Extra tests
The extra test tab offers a variety of small tests which can be used to quickly determine the
most important performance parameters of the hard drive.
Short stroke options are available for a partial test.
Explanation of the extra tests:
Random seek: performs random seek operations across the disk surface
Butterfly seek: performs seek operations moving from the outer tracks to the inner tracks and
back
Random seek / size 64 KB: performs random read/write seek operations with a random block
size (max. 64 KB).
Random seek / size 8 MB: performs random read/write seek operations with a random block
size (max. 8 MB)
Sequential seek outer: measures the transfer rate at the outer tracks
Sequential seek middle: measures the transfer rate at the center of the drive
Sequential seek inner: measures the transfer rate at the inner tracks
Burst rate: measures the highest possible transfer speed between the drive and the interface
Cache test: measures the transfer speed from the buffer of the drive and shows it graphically.
Usually the buffer capacity of the drive can be determined by checking the position where the
speed drops sharply. The screenshot shows a buffer capacity of 16 MB.
5.Info
The first part of the screen shows detailed information about each partition on the hard disk.
The second part shows which features are supported.
The third part shows basic information:
Firmware version
Serial number
Capacity as it is marketed by the manufacturer; defining 1 KB as 1000 bytes. The capacity
between braces is the capacity as shown by Windows defining 1 KB as 1024 bytes.
Buffer size: buffer capacity of the drive. Note: due to limitations of the (S)ATA specifications
only buffer capacities below 32 MB are reported. To determine the actual usable buffer
capacity the cache test from the extra tests tab can be used.
Interface standard
Maximum transfer mode and active transfer mode
Average speed: average read/write speed across the entire drive capacity.
Rotation speed: rotation speed in revolutions per minute (rpm)
6.Health
This function uses S.M.A.R.T. (Self-Monitoring Analysis and Reporting Technology) to get
information about the health of the hard disk.
The table shows the following parameters:
ID: parameter which is being measured
Current: current value
Worst: the worst value which has been recorded since the hard disk was first used
Threshold: the value of any of the parameters should never get below the threshold
Data: shows the usable data which belongs to the ID
Status: status of the parameter (OK or failed)
7.Error scan
The Error Scan scans the entire disk surface for errors. Defects will show up as red blocks. The
exact location of these defects are shown in the list below the graph.
This test only performs read operations and is nondestructive.
For a short test the quick scan option can be set. With this option enabled only certain parts
across the disk surface will be tested.
By pressing the 'Speed map' button after the test has completed you can see the read
performance across the disk.
The highest performance will be shown as green blocks, slower performance is shown in a
yellow color and very slow performance is shown as red blocks.
8.Folder usage
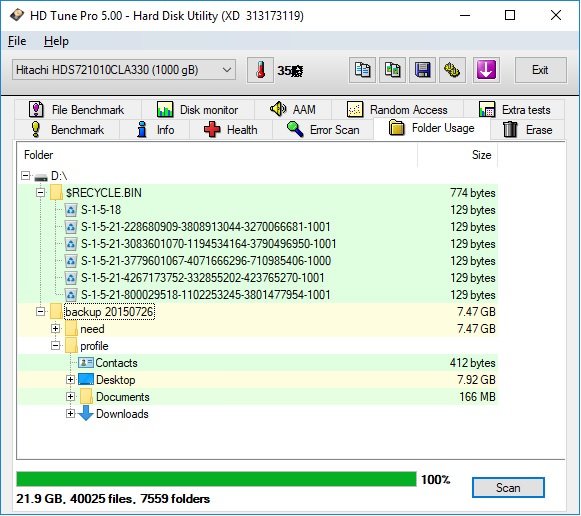
With this function you can easily see how much space each folder on the hard disk is using.
Each line in the folder list is colored according to the disk space.
Green = low disk space usage
Yellow = average disk space usage
Red = high disk space usage
9.Erase
When files are deleted from a hard disk, the data is not actually erased. Only the references to
those files are deleted.
By using recovery software it will be possible to recover many or all files after the files have
been deleted or even after a full format. So if you sell, return or give away your hard disk
someone may be able to recover sensitive data from the disk.
The erase function securely erases the disc by overwriting the entire contents of the disk with
a specified pattern.
There are four different delete methods:
Zero fill (1 pass), random fill (1 pass), DoD 5220.22M (7 passes), Guttman (35 passes).
The zero and random fill should be sufficient for most purposes. For more securely deleting
data you can use the other two methods.
Completely erasing the hard disk may take several hours. If you're using one of the multi-pass
delete methods you can select at which pass the erasing should begin.
During the erase process write errors will be reported in a similar way as in the Error Scan
function.
To prevent accidental data loss, the write test can only be performed on a disk with no
partitions (see the benchmark topic for more information).
By clicking the verify option the erased disk will be read and the contents will be verified.
A green block shows the sector is readable and contains the expected data (ie. all 0's for the
Zero Fill method).
A red block indicates the sector is either unreadable or the data does not match the expected
data.
10.Disk Monitor
The Disk Monitor function monitors the disk activity from the selected disk or from all disks.
The current and maximum read and write speeds are shown, as well as the current number of
I/O operations.
You can choose to monitor the disk activity of the selected drive or all connected drives.
11.AAM
AAM or Automatic Acoustic Management allows you to reduce the seek noise or to increase
the seek performance.
Possible values are between 128 and 254 where 254 gives you the highest performance but
also more noise while a value of 128 gives you less noise but lower performance.
To change the AAM settings move the slider and press the Set button.
The effect of the new setting can be tested by pressing the Test button
Download :HDTunePro


Good information
keep voting work as a team
good
Congratulations @lazylove! You have received a personal award!
_Click on the badge to view your Board of Honor.
Congratulations @lazylove! You have completed some achievement on Steemit and have been rewarded with new badge(s) :
Click on the badge to view your Board of Honor.
If you no longer want to receive notifications, reply to this comment with the word
STOPDo not miss the last announcement from @steemitboard!