Statistics is a Branch of Science, Not Mathematics
For the month of April, I have attended and completed a workshop for Basic Statistics. Though I had already taken up a lot of Statistics' classes during my undergraduate study, I still need to go over it again as a refresher, in preparation for the MBA Program that I am eagerly waiting to take up.

Source: PixaBay - Trends
Since this is just a 12-hour workshop, we dived into some useful applications in real life, especially those that we can relate to businesses. The workshop has been great so far, as I was not only able to refresh what I had learned during my undergraduate studies, but also had quite a handful of new learning.
For this posting, allow me to share a few insights about the learnings that I got from the workshop. This will also serve as my personal assessment whether I have really learned by heart the concepts and the applications of statistics; if not, this will serve as a review to reinforce the lessons that we discussed.
"Statistics" Defined
Source: Arstatistica - What is Statistics?
To start with, let us have a common definition of "Statistics". In a nutshell, statistics deals with the collection, analysis, and interpretation of numerical data used to make inferences and conclusions. One of the things emphasized by our instructor is that Statistics is a branch of science, not a branch of mathematics. Well you might say that what's the big deal? For us, there doesn't seem to be any difference at all. But for statisticians, there is a BIG difference, I just don't know what. Personally, I also have always thought of statistics as a branch of mathematics. The thing is, there is what we call Mathematical Statistics which is an application of mathematics to statistics.
Gathering Data / Surveys
When we create studies, in most cases, we will usually get a sample out of the entire population for obvious reasons. It will take a lot of time, money, and energy if we will create a study for the whole population. We usually have random surveys, and sometimes we just need to ensure that each group of respondents are represent in our sample size.

Source: PixaBay - Checklist
For instance, when you conduct surveys for the Election Poll to determine who will likely win the election, we usually use a sample, for instance around 5000 people. We just need to ensure that each region in the country is represented or that we have representatives for each income bracket. This ensures that the study is not biased. And from the samples, we usually generate inferences for the entire population. And since we are just using a sample, there might be a significant errors in the conclusion, this is why on most statistical studies there is what we call a degree of error. And when making inferences, we usually say "We are 95% confident..." or "We are 99% confident that Rodrigo Duterte will win the presidential elections".
Presenting Data
For most of us, when we here about presenting data, graphs will always popup: line charts, bar graphs, scattered diagrams, pie chart, and a lot of stuffs. Aside from the graphical presentations, sometimes numerical data can also be used to present a data.
For example, suppose you have a thousand data of exam scores. Given that the scores are related, we need to present it in a manner wherein the data will easily makes sense. There's is really no sense of looking at the entire data if you are not interested in looking at the individual scores at all. Suppose that you are looking for the class performance, and thus we don't have to present all 1000 scores. Average scores will be much better. We can also present the data by looking at the lowest and the highest score. Or even better, determine how many passed the exam.

Source: PixaBay - Business People
There are a lot of ways to present data. And of course, it will vary according to the scenario and depending on the neeed.
Descriptive vs. Inferential Statistics
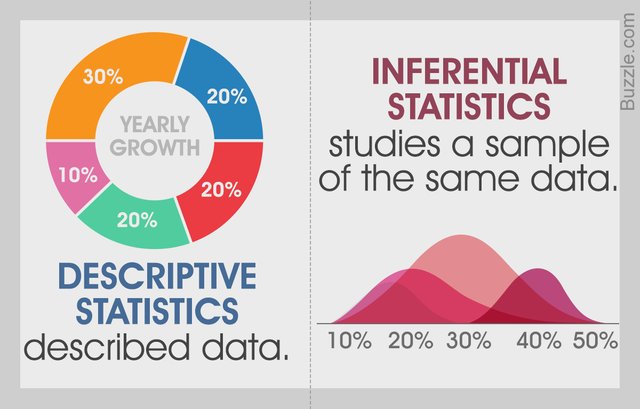
There are two major branches of statistics. Each of these branches have varying applications and techniques used to accomplish different objectives.
Source: Science Struck
Descriptive statistics is a way to describe what is going on in a population based on the data set that we have. A common application is the mean, median and mode. Inferential Statistics, on the other hand, allow us to make inferences from a sample group and generalize them to a larger population. This is very useful, because as discussed earlier, it will take a lot of resources if we are going to study the entire population.
Footnotes
I will not discuss Descriptive and Inferential Statistics in this posting. If time permits, I will talk about them separately on my next posts to give you a much more detailed discussion and idea about these branches of statistics. I am hoping that through this post, somehow I was able to give an overview of statistics.

I have to agree with on this one, not only because you broke down the complexity to bits but because it's an aspect of science that is essential in biomedical studies, scientific experiments and in every day life. This is more than just mathematical expression.
Couldn't agree more! @deliniz!
Thanks for dropping by! :)
Congratulations! This post has been upvoted by the communal account, @steemph.cebu by shoganaii being run at Teenvestors Cebu (Road to Financial Freedom Channel). This service is exclusive to Steemians following the Steemph.cebu trail at Steemauto. Thank you for following Steemph.cebu curation trail!
Don't forget to join Steem PH Discord Server, our Discord Server for Philippines.
You have been upvoted by the @sndbox-alpha! Our curation team is currently formed by @jeffbernst, @bitrocker2020, @jrswab & @teachblogger . We are seeking posts of the highest quality and we deem your endeavour as one of them. If you want to get to know more, feel free to check our blog.
Very good article, well done 👍
Thanks for the feedback @paikan!
Greatly appreciated. Cheers!
Yay, I'm doing my final year research. revisiting such info doesn't hurt.
Good luck on your research.cheers!
Thank you.
This post, with over $50.00 in bidbot payouts, has received votes from the following:
upme payout in the amount of $111 STU, $234 USD.
smartsteem payout in the amount of $105 STU, $221 USD.
For a total calculated bidbot upvote value of $216 STU, $454 USD before curation, with approx. $54 USD curation being earned by the bidbots.
This information is being presented in the interest of transparency on our platform @shoganaii and is by no means a judgement of your work.
Congratulations @shoganaii! You have completed some achievement on Steemit and have been rewarded with new badge(s) :
Click on any badge to view your own Board of Honor on SteemitBoard.
For more information about SteemitBoard, click here
If you no longer want to receive notifications, reply to this comment with the word
STOPLuckily for me, 2months now and I'm just seeing this, don't even knew how I got here, but man I'll say you're a life saver, yes statistics is a branch science on its own, but most often people refer it as a branch of mathematics, and sometimes I just keep still and let it be, but with this post I've been able to understand some basic that have seemed really unclear to keep before..... I hope to learn a lot about statistics from you
Thanks @shoganaii