Looking At Expected Value -- The Triangular Distribution Function And A Commodities Simulation (also a Spectrum Economics Challenge 3 Entry)
It's been several months since I last did a post in my "Looking At Expected Value" series. Previously, I analyzed situations that could come up in video poker and how expected value influences the correct plays. This time, I step out of the casino and into the world of investing and economics, courtesy of @spectrumecons's 3rd challenge in a series of six.
The task at hand is given a group of cities, commodities, and price ranges for said commodities, to determine the best investments to make for a portfolio with limited funds ($10 million), that will achieve the highest return on investment (ROI). In simplified terms, the goal is to turn the $10 million into as much money as possible. The only restriction is that commodities can only be purchased from one city at the start, and those commodities can only be sold to one city at the end.
Because of the goal being stated the way it is, and the fact that there are no restrictions or diversification requirements within the portfolio, there is exactly one optimal strategy. That strategy is to go all-in on a single commodity, investing the entire $10 million on the one commodity that will bring the highest return. That means that only the cheapest prices for each of the commodities at the start of the simulation need to be considered in determining what to purchase.
The Purchase Candidates
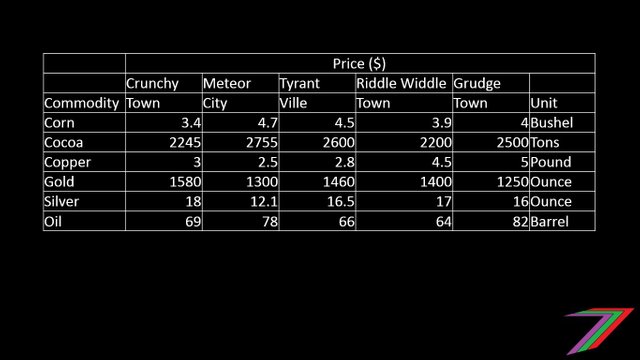
The chart of prices at the start of the simulation. Source: @spectrumecons
Only the lowest commodity prices will be considered, so the potential options for a $10 million purchase are:
- Corn from Crunchy Town at $3.40/bushel
- Cocoa from Riddle Widdle Town at $2200/ton
- Copper from Meteor City at $2.50/pound
- Gold from Grudge Town at $1250/ounce
- Silver from Meteor City at $12.10/ounce
- Oil from Riddle Widdle Town at $64/barrel
Finding The Expected Value Of A Commodity
@spectrumecons provided commodity data and indicated that prices are determined by a triangular distribution, which means that since the minimum, maximum, and mode prices are known, exact expected values of the commodities in each city can be calculated. The key is in understanding how the probability density function associated with triangular distributions work.
The probability density function is defined as follows:
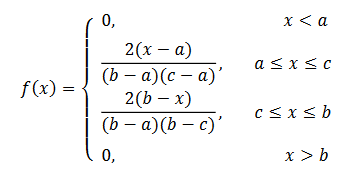
Image source: Petty and Dye (2013), Statistics Learning Centre
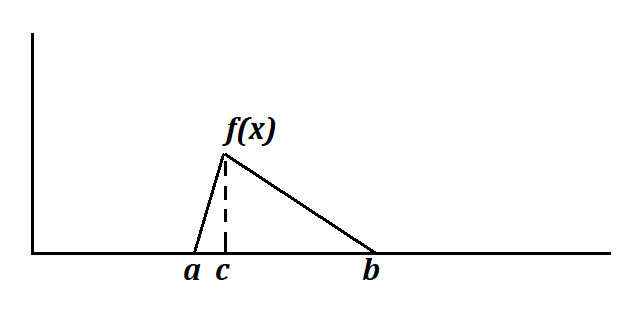
where for this simulation, a is the minimum price of a commodity in a given city, b is the maximum price, and c is the mode price. The peak, or maximum value of the function, is 2/(b-a) at price c. The expected value of a commodity then, is the sum of two integrals: the definite integral of [x * f(x) dx] from a to c, and the definite integral of [x * f(x) dx] from c to b.
So for example, suppose we want to find the expected value of silver in Riddle Widdle Town.
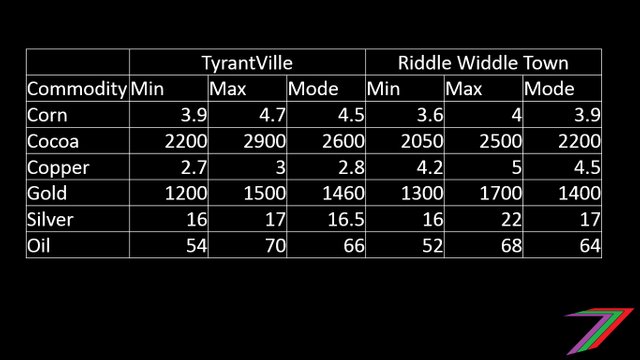
Source: @spectrumecons
From the chart, we see that the minimum price of silver is $16, the maximum is $22, and the mode is $17 (all prices per ounce). The maximum value of f(x) in this case is 2/(22-16) = 1/3, at x = $17.
We can redefine f(x) as two lines that intersect at (17, 1/3): one line goes through (16, 0) and slopes upward, while the other goes through (22, 0) and slopes downward. These two redefined lines are: f(x) = x/3 - 16/3, and f(x) = -x/15 + 22/15.
Solving for  yields 25/9 + 140/9 = 55/3 = $18.3333... per ounce, the expected value of silver in Riddle Widdle Town.
This process can be repeated to find the expected value of all commodities in all cities, and in turn, the expected ROI. Rather than provide all the definite integrals here, I've opted to put this process through a spreadsheet, showing all the numbers that are needed to complete the calculations. These are the results:
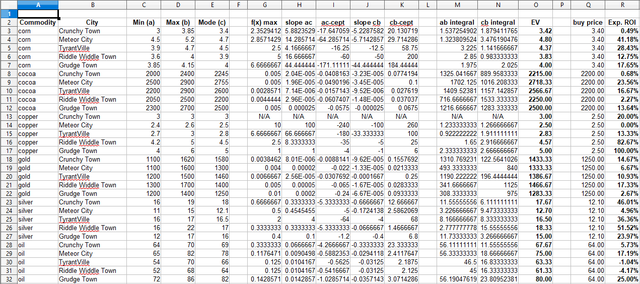
Larger version can be found here. Some numbers may be slightly off due to rounding.
The first 5 columns consist of @spectrumecons's original raw data on commodity prices. The next 5 columns show for every case (except copper in Crunchy Town, where the price is always a static $3/pound), the maximum value of the probability distribution function, as well as the slope and y-intercept of the two lines that coincide with the function for that particular triangular distribution. Following that are the values of the definite integrals derived from those numbers, which in every case sum together to produce the expected value of the commodity in a particular city. The expected ROI in each case is then calculated as:
[(EV - buy price)/(buy price)] * 100% = expected ROI
We can see from the spreadsheet that the highest expected ROI can be achieved by purchasing copper at $2.50/pound and selling it to Grudge Town at an expected price of $5/pound, for a 100% expected ROI. That means we expect to double the investment by performing this transaction, although the actual result may vary due to the nature of the triangular distribution.
My Decisions/Conclusion
Based on all the information that I have compiled together, my answer to @spectrumecons's challenge is that I choose to make my purchases from Meteor City, using the entire $10 million to purchase 4 million pounds of copper at $2.50/pound. I will then sell the copper in Grudge Town at an expected value of $5/pound, for total expected revenue of $20 million and an expected profit of $10 million. Of course, due to the nature of the triangular distribution, it is possible for the price to be as low as $4/pound or as high as $6/pound. That would equate to a potential revenue range of $16-24 million, a potential profit of $6-14 million, and potential ROI of 60%-140%.
For those readers who came here for the mathematical details, I hope you found this article to be informative and that you learned something new and interesting. I'll try to do more posts in this series if and when I come across something interesting that merits an EV discussion, whether that be from the casinos or somewhere else.