SIACOIN (SC) Teknik Analizi / SIACOIN (SC) Technical Analysis [18.04.2018]
Selam arkadaşlar;
Burada yer alan bilgi, yorum ve değerlendirmeler Yatırım Danışmanlığı Kapsamında DEĞİLDİR. Yapmış olduğum analiz ve değerlendirmeler teknik verilere dayalı eğitim çalışmasıdır.
Logaritmik ölçekli günlük grafiktir / Daily chart with logarithmic scale
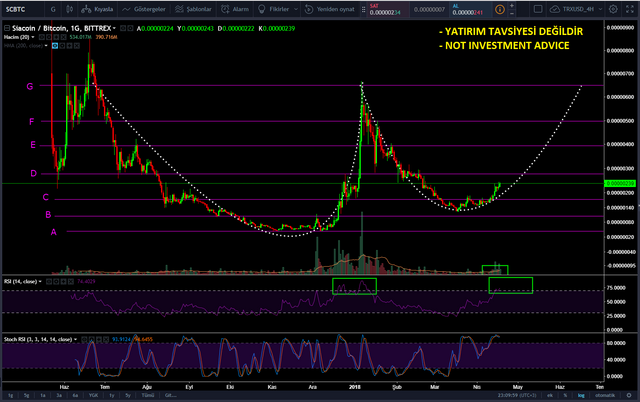
- Grafiğe göre orta ve uzun vade görünüm için fincan-kulp formasyonu oluşumunun devam ettiğini söyleyebilirim.
- Grafikteki A' dan G' ye kadar devam eden trend çizgileri, yatay direnç ve destekleri oluşturmaktadır.
- Hali hazırdaki durumda C trendinin geçilmesini müteakip D trendine doğru yükseliş hareketinin devam ettiği görmekteyiz. Burada D trendinin güçlü direnç olduğunu düşünmekteyim. Bu trendin Hacim desteği ile kırılması durumunda fiyat artışına ivme gelebileceğini değerlendiriyorum. Direnç geçilemez ise bir süre düzeltme hareketi görebiliriz.
- Formasyon tamamlanır ve G trendi yukarı kırılacak olur ise hedefler için grafiği güncellememiz gerekecektir.
- RSI indikatörüne dikkat edecek olursak; 70 değerinin üzerinde hareketlerin sert olduğunu görmekteyiz. RSI 70 üzerinde fiyat hareketini iyi takip etmek gerekmektedir.
- Hacim barlarına baktığımızda ise belli bir artış olduğunu gözlemliyoruz. Ancak önceki yükseliş hareketine nazaran biraz daha az durumda. Hacmin artmasının formasyonun tamamlanması için gerekli olduğunu düşünmekteyim.
Teknik analiz ile ilgili sorularınızı ve eleştirilerinizi yorum olarak yazmanız beni mutlu edecektir. Analiz etmemi istediğiniz kriptoparaları yorumlarda belirtebilirsiniz.

English
Hello Friends;
The informations, comments and evaluations contained herein are NOT IN Investment Advisory. The analyzes and evaluations I have made are based on technical data.
- According to the graph I can say that the formation of cup-handle formation continues for the medium and long-term outlook.
- The trend lines from A to G in the chart form horizontal resistance and support.
- In the present case, we see that the uptrend towards the D trend continues after the C trend has passed. I think D trend is a strong resistance here. I believe that if the trend is broken with volume support, the price increase may accelerate. If the resistance can not be passed, we can see the corrective action for a while.
- If the formation is completed and the G trend is broken up, it will be necessary to update the graph for the targets.
- If we pay attention to the RSI indicator; We see that moves above 70 are harder. It is necessary to follow the price movement well on RSI 70.
- When we look at the volume bars, we observe a certain increase. But a little less than the previous upward movement. I think that the increase of the volume is necessary for the completion of the formation.
I would be happy if you write down your comments about technical analysis. You can specify the cyriptocurreny you want me to analyze in comments.
Önceki SIACOIN (SC) Teknik Analizlerim / My Previous SIACOIN (SC) Technical Analysis
Birinci SIACOIN (SC) analizidir. / The first analysis of SIACOIN (SC)
Bilgi verici bir yazı olmuş emeginize sağlık 😊
Teşekkür ederim. :)