XN0PNEWS :: Visualizing Instruction With rgat :: XNOPNEWS
This is a really cool project I have been working on and contributing to.
rgat
An instruction trace visualization tool intended to help reverse engineers make the link between target behavior and code
What is rgat?
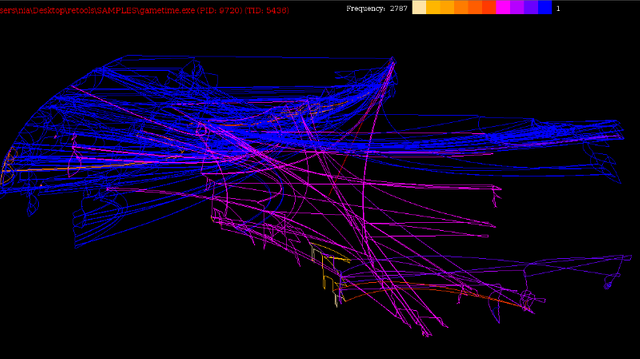
rgat uses dynamic binary instrumentation (courtesy of DynamoRIO) to produce graphs from running executables.
It creates static and animated visualizations in real-time to support types of analysis that might be a lot more cumbersome with disassemblers and debuggers alone.
Edge frequency Heatmap:
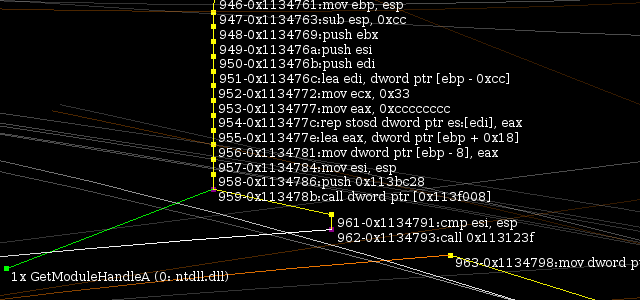
Static view zoomed into individual instructions:
You may also want a brief introduction to the graph layout.
Latest Version
Version 0.2 is here for Windows x86 targets only, at the moment. Most of the file size is the included minimal DynamoRIO distribution.
Significant changes in the trace generation from v 0.1.* mean that execution for many applications with tightly looping code is at least an order of magnitude faster.
Some features (replay, divergence) have been temporarily disabled as a result. See the CHANGELOG for further details.
Download/Installation
It's built to depend on the Windows 10 Universal CRT so if you have a version lower than that you might need to install it
Unzip it, run it.
Try to execute something. If you get an error then you likely need to install the Visual C++ Redistributable for Visual Studio 2012, because of reasons.
It should create a default config file at start-up, feel free to customize.
Running
Virtual Machines and OpenGL do not get on well together. rgat works on VMWare Workstation with a Win 7 guest but it tends to crash VirtualBox. You can use it from the command line in environments without 3D capability and export the save file for analysis elsewhere.
Run, save and load traces from the file menu. Other functionality should be reasonably self-explanatory from the other menus.
run from the command line with -h to get a list of command line options. Ctrl-C will force rgat to save everything it has so far and quit.
Graph navigation is intended to be similar to Google Earth: drag it with the mouse and zoom with the scroll wheel. Num pad 7,8,1 and 2 allow finer grained zoom control.
Press 'n' to stop the stuff on the back of the sphere cluttering up your view, and 't' and 'm' to toggle instruction and dll text to the situation if the defaults don't work for the situation.
Use the arrow keys to stretch and compress the graph you are looking at. Turn off autoscaling in the options menu if rgat doesn't like it.
Problems
See Issues and Limitations
Excuses
This is an unstable preview release (0.1.1). I promise not to use that excuse for long.
Its reliance on DynamoRIO means that rgat suffers from all of the same limitations. 99% of problems you find will be my fault, though.
Instrumenting arbitrary code - especially malicious obfuscated code - tends to present a lot of edge cases.
'rgat'?
'runtime graph analysis tool' or 'ridiculous graph analysis tool', depending on your fondness for the concept.
rgat relies upon:
- DynamoRIO for generating instruction [opcode] traces
- Capstone for disassembling them
- Allegro 5 for managing OpenGL and handling input
- agui for a lightweight UI that didn't involve distributing GTK/Qt/etc
- base 64 code for platform independent encoding.
source:
https://github.com/ncatlin/rgat