4 indicators you need to know to trade bitcoin
Bitcoin can be traded directly via cryptocurrency brokers or via derivatives with stock brokers . Whether live or via derivatives , it is possible for a trader to take advantage of short-term cryptocurrency fluctuations.
Discover in this article how to use technical indicators to trade Bitcoin well on a daily basis. We will therefore return in detail to the technical indicators RSI, MACD, Bollinger Bands and Fibonacci Suites to identify buy and sell signals on Bitcoin.

#1-The RSI for trading Bitcoin

How to use the RSI in your day trading on Bitcoin?
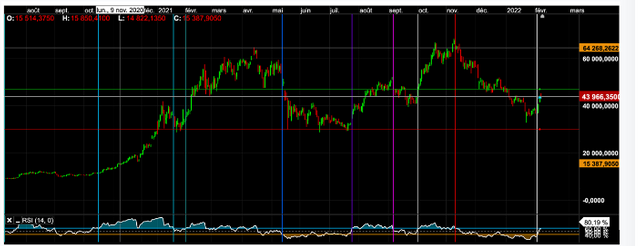
The RSI indicator measures the ratio of upward and downward movements and normalizes the calculation so that the index is expressed in a range from 0 to 100.
If the RSI is around the 70 level, it is assumed that the instrument is overbought. This is a situation in which prices have risen sharply, and the movement is likely to weaken.
If the RSI is around the 30 level, it is a technical signal that the instrument may be oversold. In this case, it is a situation in which prices have fallen sharply, and the movement could now lose strength.
If the indicator oscillates horizontally around the 50 threshold, it means that the market lacks trend. The 50 level is the middle line that separates the bullish and bearish territories of the indicator.
Crossing thresholds 30, 50 and 70 give trading signals.
By default in the analysis, we use the most commonly used 14-period RSI.
Lacking signals on terminals 70/30, we reduced to 60/40. This created additional signals for us to analyze.
Advantage of RSI for Bitcoin Trading
The indicator is bounded which makes it easy to compare its reaction to the sometimes very sudden movements of crypto-currencies.
Disadvantage of RSI for Bitcoin Trading
It is easy to see that BTC is rarely oversold and that it is difficult to analyze the RSI in the same way for BTC as for FOREX for example.
How to Make Bitcoin Investment Decisions with RSI
It is at the breakout of the oversold limit (reintegration into the 40/60 zone) that we have a buy signal. Conversely, an exit from overbought does not put forward a sell signal in the majority of cases.
We highlighted the support at 30,000 which held up several times.
#2-The MACD for trading Bitcoin
How to use the MACD in your day trading on cryptos?
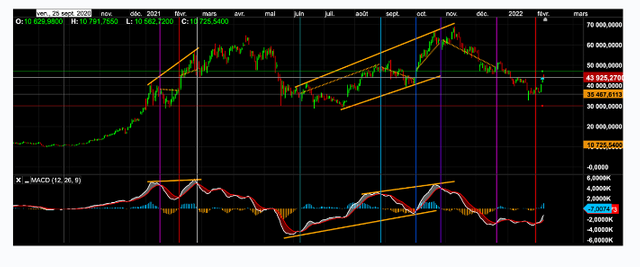
The MACD indicator consists of the following elements:
*Exponential Moving Average (EMA) 26 periods;
*Exponential Moving Average 12 periods;
*MACD Signal Line;
*MACD Histogram.
The evolution of the signal line and the MACD histogram, in particular their crossing, will provide the trader with trading signals, to enter or exit the market.
Advantage of MACD for Bitcoin Trading
The MACD indicator is also an oscillator and makes it easy to compare one movement with another.
Disadvantages of MACD for Bitcoin Trading
The MACD indicator is the source of false signals with the lack of deviation of the moving averages of the indicator, especially over the period from March to June 2021.
How to Make Bitcoin Investment Decisions with the MACD
We had to decide on the fact that the MACD is a divergence indicator for BTC, where it is often an arbiter for Forex. It can be seen that the volatility of BTC is so great that it takes the MACD with it.
The MACD makes it easier to take a position on the purchase than on the sale. The periods of sale are longer than the periods of purchase on the BTC, this will have the advantage of being exposed to the risks for less time.
#3-Bollinger Bands for Crypto Trading
How to Use Bollinger Bands in Bitcoin Day Trading?
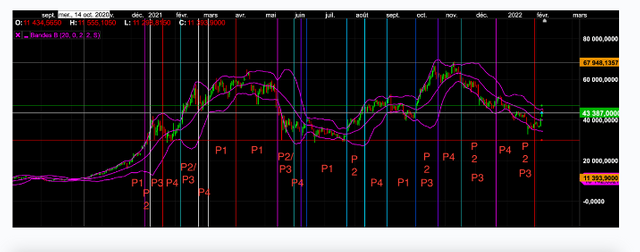
Bollinger Bands are two lines both above and below a central moving average, encompassing price.
We know that 95% of the time price is within the standard deviation and that big moves are characterized by an exit.
We cut the movements into 4:
*P1 = accumulation (the bands tighten or are straight);
*P2 = explosions (the bands move apart);
*P3 = the tunnel (the bands move in the direction of the price);
*P4 = contraction (the bands tighten).
Advantage of Bollinger Bands for Bitcoin Trading
Bollinger bands are a good indicator of volatility , especially for BTC, as well as for commodities , thanks to sudden, fast and short movements.
Disadvantages of Bollinger Bands for Bitcoin Trading
The chart shows exits from the price of the standard deviation and a very fast reintegration, to the point of not influencing the bands to move towards the price, the false signals seem more numerous in the sell than in the downside a once again.
#4-Fibonacci to trade Bitcoin.
How to Use Fibonacci Retracements in Bitcoin Day Trading?
Fibonacci retracements are based on the mathematical theory that was invented in the 12th century by the Italian mathematician Leonardo of Pisa, also known as Leonardo Fibonacci who owes his popularity to his famous sequence which now bears his name, the sequence of Fibonacci.
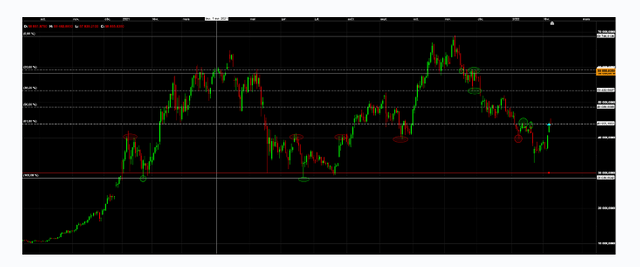
In trading, this sequence is used to highlight key supports and resistances on the chart.
Benefits of the Fibonacci Sequence for Bitcoin Trading
In this case, the retracement starts from the low of the year, at 28,600, towards its high in November 2021.
Since then, we have been in a decline and we have highlighted with the green circles the important points of the graph which react on the retracement in the decline.
Disadvantages of the Fibonacci Sequence for Bitcoin Trading
We are not able on recent elements to provide a point of comparison on the upcoming rise of the BTC index.
Also, in the red circles, we distinctly see that Bitcoin is reacting strongly on the 40,000 sector.

How to make Bitcoin investment decisions with oscillator indicators
Oscillator indicators are reliable enough to make an investment decision on Bitcoin buying but not falling.
Regarding Fibonacci, it is interesting to take this indicator into account as an exit point in the decline, and it is to be completed with a support line at $30,000 and $40,000.