A Technical Look at How to Design a 1 Million Gallons Per Day Well Network for a City
Civil engineers are tasked with supplying municipalities with drinking water needs, and here is how it's done.
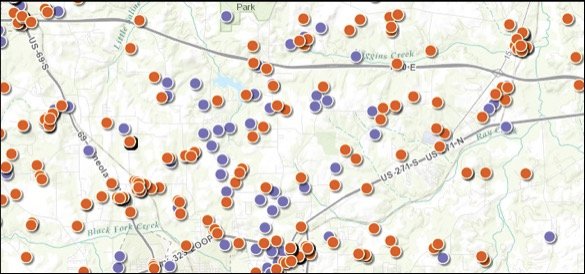
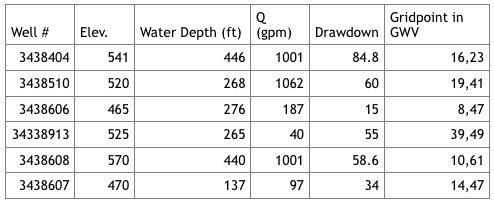
I am going to take you through a theoretical project that I worked on demonstrating the proper design of drilling, placing, and designing a well and pipe network system capable of supplying 1 million gallons per day to the city of Tyler, Texas. I am a local in the area, and I went with this location because I knew where to find the applicable data. Each state has a system that compiles drilling logs from oil and water wells drilled in the past. Each dot in the photo above represents a well of some kind. Under Tyler, there are 2 different aquifers, the Queens-City and the Carrizo-Wilcox. I did some preliminary modeling on each aquifer from examining the drill logs, and determined that the Carrizo-Wilcox would be the best water source to meet out requirements. Below, you can see a chart of drill log data I found showing the varying elevation drillers found water at. I used this data to model the aquifer in a program called Groundwater Vistas.
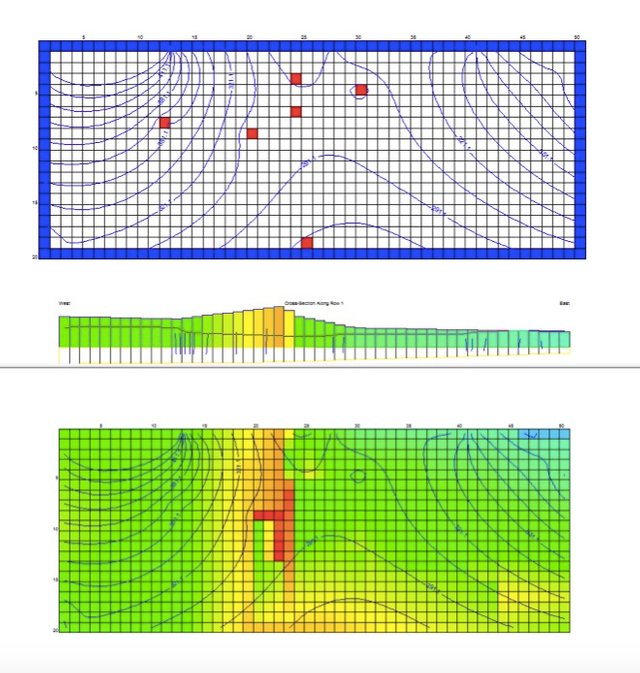
The Carrizo-Wilcox Aquifer was modeled with a 20 by 50 grid representing 4 by 10 miles (model below). It was modeled in 2 layers because this aquifer is confined. A confined aquifer has impermeable layers on top and bottom. Think of it as a balloon or a sealed container. This model was based off the thickness of the aquifer and the confining layers. Essentially, the top of the aquifer (bottom of confining layer) was set to equal 0 ft. in elevation. The top and bottom elevations were then adjusted in order to maintain the appropriate thickness of each layer. This was done because problems arose in the elevation modeling and this method provided a solution to the model without affecting results.
You can take a look at the resulting model below. Red indicates a high drain on water, and green indicates a good supply. The curved lines are elevation gradients in the water level due to existing pumps.
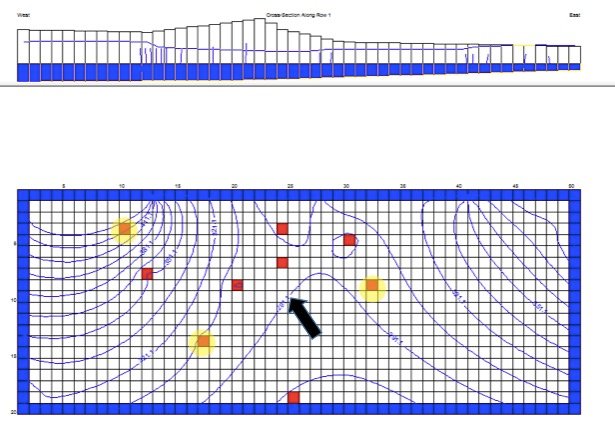
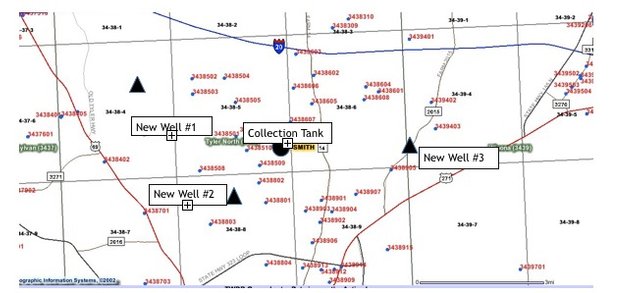
The new wells inserted into the design for calculation are highlighted on the model below. These locations were selected based upon this aquifer’s existing well locations and placed strategically to achieve the maximum flow rates from the Queen’s City Aquifer.
Starting from the left, the wells have flow rates of 136,000 GPD, 432,000 GPD and 432,000 GPD.
It can be seen at the middle new well that the surrounding area is being completely drained of water. If a pipe system was to be designed, the collection tank for the three wells would be in a centrally located position. Similar to the location marked with an arrow on the Model.
So far, this mapping process of existing aquifers and wells would be very similar to what a practicing engineer would use to determine where they would like to place new wells. All of this effort has been to create a functioning model of the water table in the aquifers below the city. Once the models are good enough, then wells can be placed in the models to determine where the best locations for new wells would be.
The pumps for each well must be able to work in a pipe that is less and 12” in diameter. All of the wells designed utilize a 12” diameter pipe fitted into the well hole, per specifications of this theoretical project. The depth of the Aquifer ranges, but the maximum depth the pump will need to be at is 950 ft. This was determined through looking at existing wells and drillers logs and seeing where the bottom of the aquifer is. The maximum depth observed at existing wells is 874 in depth at well no. 3438404. The value of 950 ft. was determined by adding 10% of the maximum depth to allow for variation of aquifer depth at the drill site. Using this maximum depth, the pumps were evaluated by the least amount of head loss at the pumping depth of 950 ft.
To state that a little simpler, I used drill data to figure out the depth of the aquifer at each proposed drilling location. Using that depth, I decided how deep each well hole needed to be drilled. The next step coming up is selecting a pump to pump water to the surface. I took a look at various pump curves, like the one below.
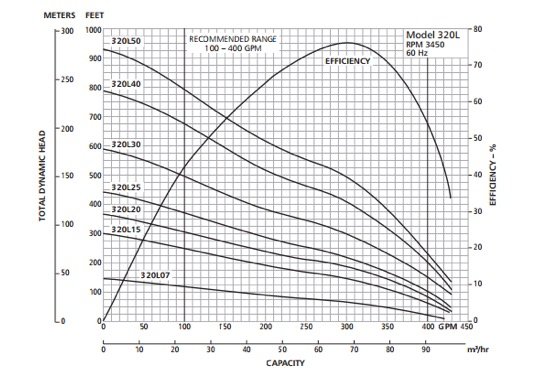
Pump curves demonstrate where a pump is most functional i.e. most efficient depths and flow rates. By taking the numbers you desire, and plugging them into various pump curves, you can determine which pump you need.
The L Series 320L Submersible pump was determined to be the best fit for the well system. The Pump Curve can be observed above.
The 320L operates at max efficiency at 950 ft. of head with a capacity of 300 GPM (432,000 GPD). Two wells of this size would produce 864,000 GPD. This allows for a third well to be drilled, with a necessary production of 136,000 GPD minimum. This third well will allow for extra production of water if necessary to counteract the head losses in the piping network. In total, these 3 wells would produce the desired 1,000,000 GPD for the city of Tyler.
The locations were selected based upon proximity to existing wells as well as the ability to construct a centrally located reservoir for the flow of 1 MGD. Each new well’s specifications are outlined below.
Well #1: Q=432,000 GPD, Depth 875 ft. below surface
Well #2: Q=136,000 GPD, Depth 800 ft. below surface
Well #3: Q=432,000 GPD, Depth 775 ft. below surface
The collection tank will be located at the circle location marked on the above map. This location was decided on in order to produce the least amount of head loss through the length of piping. It was also selected based upon its centrally located position between the new wells and also the overall project area.
At this point, the last step would be coordinating the construction teams and purchasing the materials. I left out some of the more technical aspects of the process, but this should give anyone reading a good overview of how new drinking water wells are designed.
This is a really great article though a little over the head of the masses. Keep up the good work.
Thanks man!
This is a really interesting article. Is it possible to do these kinds of models without proprietary software?
From the looks of it, your aquifer data is represented in matrix form, and then you have the GIS data to go with it, so it seems like there's no voodoo, just a lot of moving parts. I guess I'm just curious about whether you trained to do this stuff 'by hand', as it were, and now the software takes a lot of the pain out of it.
Nice @trevorjenglish
Shot you an Upvote :)
Hi! This post has a Flesch-Kincaid grade level of 7.4 and reading ease of 75%. This puts the writing level on par with Tom Clancy and F. Scott Fitzgerald.