How floods will devastate Gingoog City, Philippines?
Rationale
The Philippines ranks third of the most hazard-prone country in the world, it is a natural hotspot with approximately 50.3% of its total area and 81.3% of its population vulnerable to natural disaster (Senate Economic Planning Office, 2013). One of the most devastating and frequent natural disasters in the Philippines is flooding that happens expectedly in the populated floodplains adjacent to rivers and streams. Adverse effect on the health and safety of localities and the economy around the country are among of the major impacts of flooding under the new normal. Owing to the continually changing nature, floodplains are mostly prone to flooding that need to be examined in the light of how they might affect or be affected by land use change (Abolghasem et al., 2014).
In recent decades, tropical cyclones with extreme precipitation devastated Northern Mindanao causing rivers to overflow past from the expectation of the local government units and local communities. As a result, damages of properties and loss of lives due to flooding becomes a great challenge on the government both at the national and local level. The use of models has been the trend in quantifying flood extents and river inundations. The Hydrologic Engineering Center- River Analysis System (HEC-RAS version 5.0 beta) the latest version developed by Hydrologic Engineering Center - U.S. Army Corps of Engineers. HEC-RAS 5.0 beta is an integrated system capable of performing two-dimensional (2D) unsteady flow modeling and 2D unsteady flow routing with expanded capabilities in topographic processing of terrains used in model geometry development and additional post-processing model features such as dynamic mapping (on-the-fly) for flood animations (Brunner, 2014). With the integration of LiDAR (Light Detection and Ranging) technology which provides high resolution terrain data, a remote sensing technology acquires terrain information through laser pulses from the airborne Global Positioning System (GPS) receiver with high level of accuracy. The HEC-RAS 5.0 utilizes the high resolution terrain data to produce a sub-grid model which represents the detailed hydraulic table properties for computational cells and cell faces for 2D flood simulation. The resulting 2D flood maps gives enhanced representation and precise quantification of flood extents helpful in identifying the priority areas for immediate responses especially during flood disaster scenarios. The Mines and Geoscience Bureau identified Gingoog River to cause overflowing that resulted to extensive flooding. The river traverses a highly urbanised floodplain wherein the Gingoog City is situated. As the floodplain is host to densely populated areas as well as commercial and agricultural zones, flooding due to overflowing of the river resulting to significant damage to human lives and properties.
During flood incident in 2009, a 1.0 meter flood distresses a total of 2,013 individuals (Gingoog Local Government Unit, 2009). The local government of Gingoog City, especially the Disaster Risk Reduction Management Council (DRRMC) is in need of an accurate and reliable flood map which identifies the affected areas that need immediate response during emergency cases. In addition, flooding information serves as the basis for future policy implementation (i.e. land use zoning, construction of establishments). The  study aimed to create flood hazard map using HEC-RAS version 5.0 in the flood plains of Gingoog River, Mindanao. The model was run using 2D flow areas and 2D unsteady flow routing then it was analysed using RAS Mapper to produce flood maps. The generated maps provide information and visualization as well as, the basis for policy making regarding land use
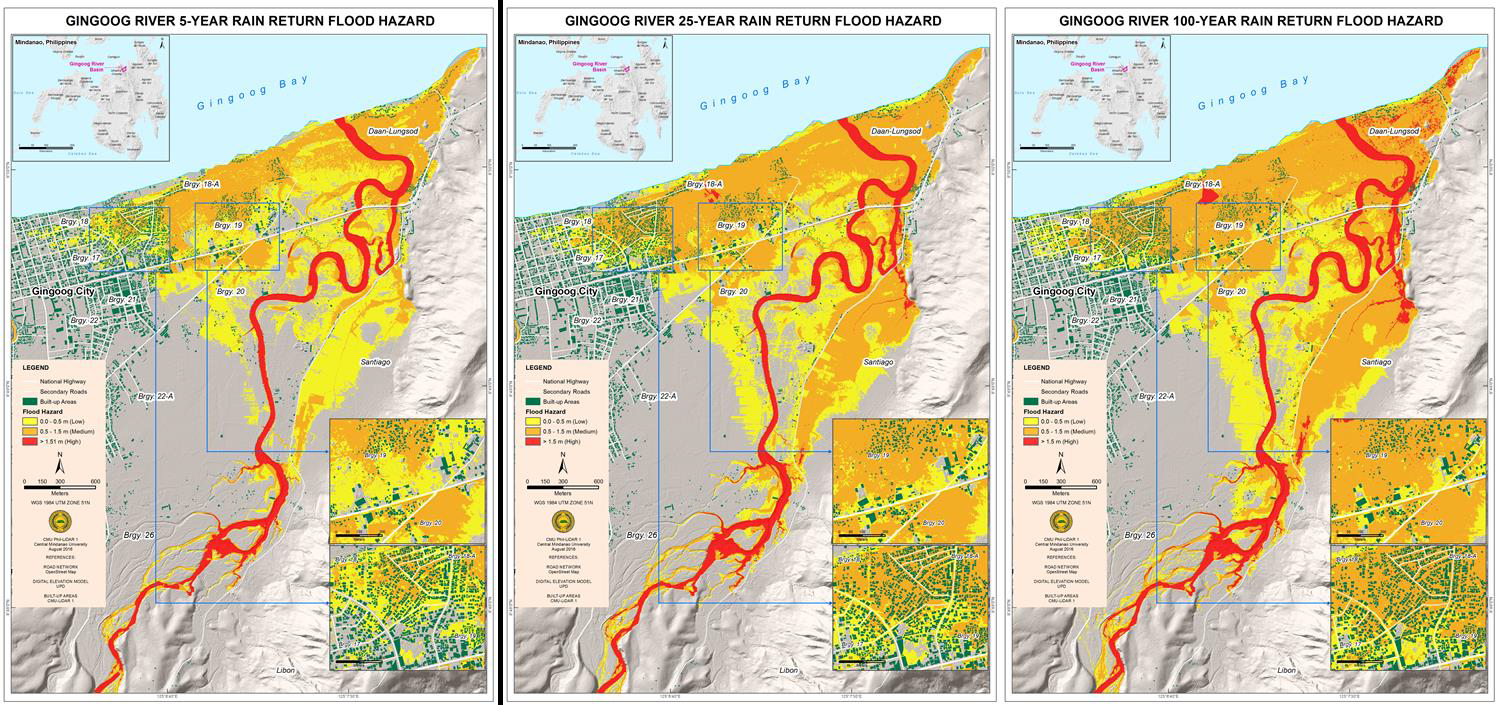
Shown in the figures the 5-year, 25-year and 100-year return period maps. These maps show the areas that have been flooded, including the maximum depth of flood within the duration of the simulation periods. It can be observed that the flood extent is increasing evident from 5-year to 100-year return period. The spatial distribution of flood extent is covering in areas with relatively low relief corresponding to agricultural, reclamation, and near river channel which covers an area of about 4.68 km2, 5.74 km2 and 6.37 km2 for the three return periods, respectively. The result of the overlay identified the affected built-up areas in the barangays of Gingoog City such as residential, commercial, and road network. Flood hazard expressed in terms of depths ranges from 0.0 - 0.5 m (Low), 0.51-1.50 m (Medium), and above 1.51 m (High), indicated with yellow, orange and red in the map, respectively.
Resulting generated 2D flood maps shows more enhanced representation and precise quantification of flood extents helpful in identifying the priority areas for immediate responses especially during flood disaster scenarios. Development of these maps answers the dire need of the Local Government Units including the Disaster Risk Reduction Management Council (DRRMC) of Gingoog City to have more accurate and reliable flood maps to a more enhanced disaster strategies as well as to be used as basis for future policy implementation (i.e. land use zoning, construction of establishments).
Flooded Buildings
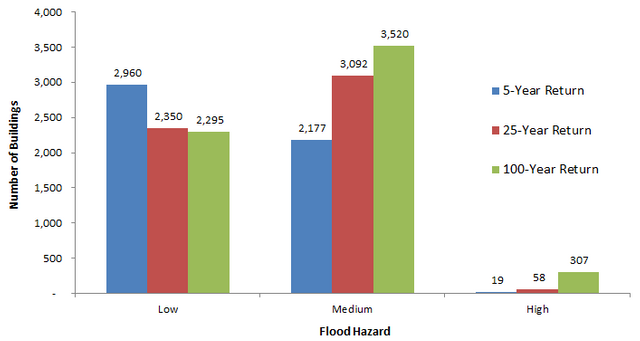
Approximately, there were 8,293 buildings within the study area. The results of the overlays and geospatial analysis for the 5-year return flood event revealed that about 62% of these buildings were estimated to be affected by flooding (Figure 9). Around 2,960 were located in low flood hazard areas while 2,177 and 19 were in medium and high flood hazard areas, respectively. In the 25-year return flood event, geospatial analysis showed over 66% of buildings were affected by flooding, about 2,350 were found in low flood areas while in medium and high flood hazard the number of buildings affected by flood were slightly higher than the 5-year return flood. In the 100-year return event, it is the most number of buildings affected by flood. The overlays shown about over 73% of the buildings were affected by flood. A total of 2,295 were located in low flood hazard while 3,520 and 307 were located in medium and high flood hazard, respectively.
References
Senate Economic Planning Office, 2013. Natural disaster at a glance, Retrieved May 20, 2016, from https://www.senate.gov.ph/publications
Abolghasem, M. Golamali, F. Mohsen, and S. Maliheh, 2014. Modern Applied Science; Impact of Landuse Change on River Flood plain Using Public Domain Hydrologic Model. Canadian Center of Science and Education, Vol. 8, No. 5.
Brunner, G. W., 2015. Hydrologic Engineering Center River Analysis System 2D Modeling User’s Manual Version 5.0, CEIWR-HEC, Davis, California.
Gingoog Local Government Unit, 2009. The Comprehensive Land Use Plan 2010-2019. Gingoog City.