The Google Earth Engine: Accessing Google's servers for geoprocessing remotely sensed data
Hello everyone! Last week I dug deeper into a relatively new technology that in my opinion can be seen as a new milestone in geoprocessing remote sensed data, The Google Earth Engine. Do not confuse this with Google Earth. While Google Earth is a tool that allows everyone to browse satellite data, it is not possible to manipulate this data or execute complex analyses with it.

Image assembled from source
A limitation that many researchers face when analyzing a large study area is the availability and storage of (free) detailed and continuous data for the large area, and the accessibility of the computing power to execute the analysis. These two requirements can become very resource consuming and this is where Google steps in. Google developed the application "Google Earth Engine" where a wide range of free to use global data is made accessible for the user. Not only can this data be accessed, it can also be used in your own calculations using a javascript-based coding tool.
Accessing data from Google's servers
We all know Google owns pretty impressive data centers and thanks to all their capacity, users do not have to search the web for the right terrain data and download a huge amounts of files, consuming all of your storage. They offer a wide range of data sources such as the most common:
- Landsat 5, 6, 7 and 8
- Sentinel 1, 2 and 3
- MODIS missions
- Nighttime light series
- SRTM
- ASTER
- TRMM
- and really many more...
Thanks to this, almost all information can be obtained from these data sets such as digital elevation models, land use maps, NDVI... The possibilities are endless.

Google data center in Oklahoma from source
Using Google's computing power
Another great feature is that the commands you enter in your script editor are sent to the servers and all of the computer power is done on their end. They divide the imagery in tiles and those tiles are send to individual servers. These servers will execute the code for their specific tile and return the output. This output is sent to your browser and your calculation, that otherwise would take hours, return in only a few seconds.
Since all calculations are sent to servers, the specs of your own workstation do not matter since it only functions as a way to communicate with the application. Furthermore there is no need to download any data or software for using the Earth Engine which is one of its main advantage.
User's example
I am currently working on a paper to introduce this technology in the assessment of desertification on a much larger scale then previously studied. I'm really enthusiastic about this work and I will definitely write more about my progress since I can't shut my mouth about it 😄.
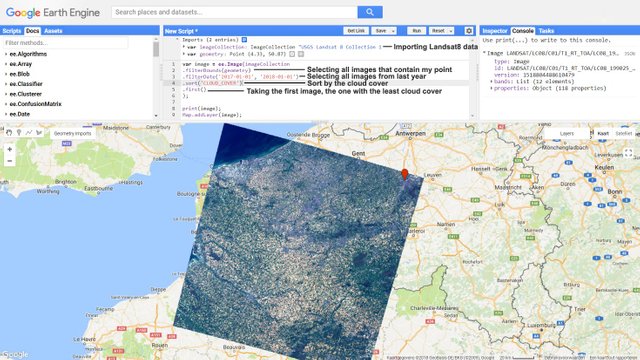
Click on the image to view it in its original size
In this example I simply imported all landsat 8 imagery. From that image collection I filtered on location, date and cloud cover to show the basic. With this tool you can also easily export data tables and images to your computer for in reports or presentations.
What I wanted to say
So what I actually wanted to do was point out the advantages and practicalities of the tool and getting it know by other researchers like you all. It really opens up large scaled quantitative analyses for all researchers allow them to expand their focus area.
If you want to get started with this new tool but get stuck at some point, or you have more questions about the technology, you can always contact me on Discord.
Really looking forward to other posts of this discussion. An interesting tool I never knew until now :) @samve good luck in your research
Thank you! I only discovered it fairly recent as well so I will probably discover even more features as I go.