Determination of Entropy, Enthalpy, and Free Energy Change
Image Source
Introduction
The two-sided arrow indicates that the reaction is reversible and undissolved solid is in equilibrium with the dissolved ions. This is known as a saturated solution in which the rate of dissociation is equal to the rate of precipitation. The equilibrium constant expression defines the equilibrium constant (Ksp) for KNO3 dissolving in water which can expressed as
The equilibrium constant is a measure of solubility expressed as a product of the molar concentration of ions. As solubility increases with increasing temperature, the value for Ksp for a compound also increases with temperature.
Interestingly, the solubility of a salt can be used to determine the thermodynamic properties of the reaction. The energy difference between the solid salt and its dissolved ions is known as the enthalpy change (ΔH), and the relative disorder of the dissolved ions is an indication of the entropy change (ΔS). The free energy change (ΔG) for a salt dissolving in water indicates whether the process will occur spontaneously. The mathematical relationship between the changes in free energy, enthalpy, and entropy is illustrated by Gibbs-Helmholtz equation which can be derived by combining the First and Second Laws of Thermodynamics. The equation can be simply written as
A mathematical relationship also exists between the free energy change and the solubility equilibrium constant. This equation is written as
where R is the gas constant (8.314 J/mol·K), and T is the temperature in Kelvin. Equating the third and fourth equations results in
which can then be rearranged equation into the form of a straight line as
By plotting In Ksp versus 1/T, the slope of the line is –ΔH/R and the y-intercept is ΔS/R. Hence, the purpose of this activity is to determine the thermodynamics variables of ∆H, ∆S, and ∆G for the dissolution reaction of potassium nitrate in water by investigating the dependence of the solubility equilibrium constant across a range of temperature.
Experimental
Ten grams of KNO3 was obtained and transferred to a test tube with 7.5 mL water. It was then heated and then cooled. The volume and temperature was recorded during the very first appearance of salt crystals in the solution. The volume was measured by using two identical test tubes and a graduated cylinder while temperature was measured using a thermometer. The solution was then heated after adding about 2.5 mL, and consequently, volume and temperature was recorded on succeeding appearances of crystals. The procedure was done in three trials.
Data Collection and Calculations
To evaluate the solubility equilibrium constant Ksp, the molar concentrations of K- and NO3- must be known. In doing so, the concentration of KNO3 is calculated as
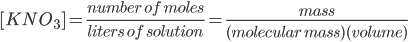
Based on the stoichiometry of reaction, the ratio of KNO3, K- and NO3- is 1:1:1. Thus, the concentration of KNO3 is equal to the concentration of K- and NO3. Mathematically, it can be written as
Hence, the equilibrium constant expression becomes
Knowing the equilibrium constant at each temperature, it was possible to determine Gibbs free energy by using the equation ∆G = -RTlnK where R was a constant, T was temperature, and K was the equilibrium constant.
In addition, the graph must consist of 1/T versus lnK in order to fit the equation of a line from the sixth equation
Hence, tabulated values of 1/T and lnK must be generated which will then be subjected to linear regression analysis.
And finally, the thermodynamic values can be computed as
For the first volume reading of Trial 1, the following calculation was employed.
Sample Calculation
| Parameter | Value |
|---|---|
| Volume | 11.2mL |
| Mass | 10g |
| Temperature | 71.7oC |
| Molar Mass | 101.02 g/mol |


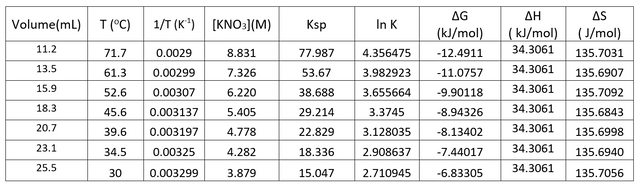
Table 1. Raw Experimental Data: Volume and Temperature at which crystal first appeared
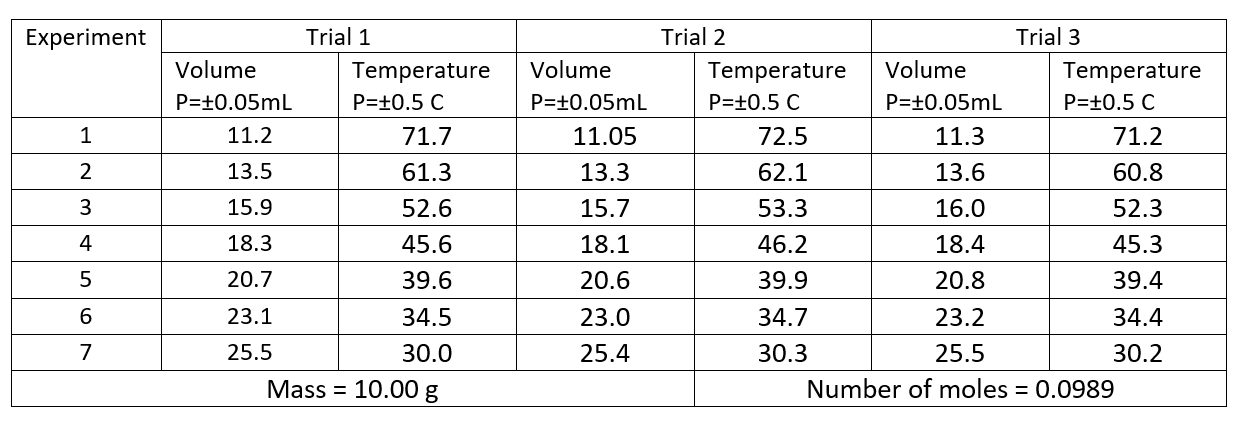
Table 2. Determination of Ksp at Different Temperatures
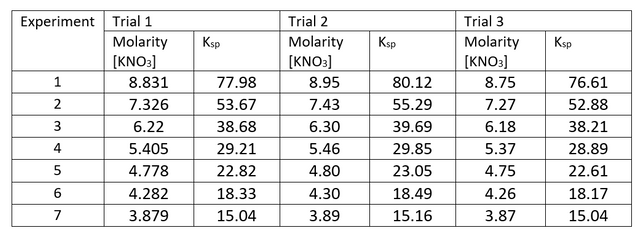
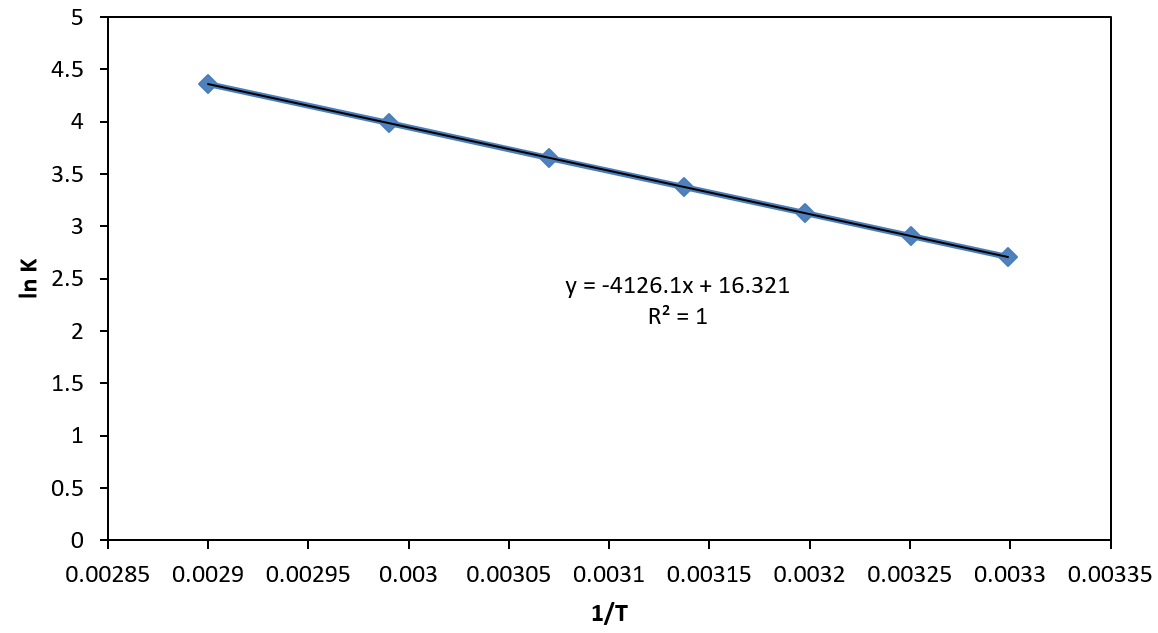
Figure 1. Graph of 1/T versus ln K
Table 3. Summary of Experimental Thermodynamic Properties
Discussion of Results
Despite the strict adherence to the experimental procedure, a considerable error for entropy and free energy change was obtained. This is most probably due to the following reasons. Slight errors such as misreading the volume of the solutions and losing water to evaporation likely amounted to the experiment but did not play a significant role in the actual error. Another is the interactions of ions and the ionic strengths of the solutions were ignored in the experiment, and they might had much influence. Hence, it was assumed that KNO3 is an ideal solution in this experiment.
However, the major source of error in this activity was that the temperature at which we observed crystal formation was lower than the temperature at which real equilibrium was established. This is because visible crystal formation means that equilibrium has been passed and there is no way for the limited capability of human eye to see exactly when the very first crystals start forming. This delay resulted in a lower reported temperature and thus a less negative Gibbs free energy and a higher than actual entropy change. Fortunately, the enthalpy change did not depend on this much as it was just the slope of a line but the y-intercept was severely affected. In other words, the line shifted to the right of what it should have been and at each equilibrium point, the temperature was actually lower and 1/T was actually higher. Thus, the experiment had a higher y-intercept and a higher entropy than there was in reality. And since delta G is also dependent on ∆S, ∆G had a more negative value than the actual resulting to considerable error from standard values.
Conclusion
The important thermodynamic properties such as change in enthalpy, entropy, equilibrium constant and Gibb's free energy for dissolving a salt in water were discussed and measured experimentally with reasonable accuracy using the procedure and data analysis presented herein. Moreover, the deviation of experimental value from standard value can be attributed to instrumental limitation coupled with the assumption of ideality.
References
My Laboratory Experiments at the University
Atkins Physical Chemistry
Knowledge is power!

Wow! this is some kind of content. Very interesting. I also teach science but i the elementary level, not this kind of high subject with a high learning curve. :) Nice post
Thanks po sir @jerome-morales! Science is life!
@originalworks
Hi Ruel great article and you can submit similiar articles to the steemstem tag which would look over posts that are science technology education and math in nature.
Some things to go remember if you will submit there is the use of image sources and credits to knowledge sources although you stated there it was through your own experiments.
Treat it like you are writing a science article to be submitted to professors who would undoubtedly look for sources.
But great work and all the best to STEM type posts to you.
Yes, I always make sure there are no copyright issues in my articles. For this one, I was writing based on the knowledge I got from Atkins Physical Chemistry book which was cited accordingly. Thank you for your kind reminders.
You got a 1.31% upvote from @postpromoter courtesy of @ruel.cedeno!
Want to promote your posts too? Check out the Steem Bot Tracker website for more info. If you would like to support the development of @postpromoter and the bot tracker please vote for @yabapmatt for witness!