You are viewing a single comment's thread from:
RE: Global Sea Ice Area - This chart should worry you...
Without taking a position on the climate change political drama... In any other context, my first reaction to that graph would be that it looks like there's a programming bug.
I don't have much time to spend on it, but I was curious, so I did a little googling on bing. Note that I'm not making any sweeping claims about climate change, I'm just responding to this particular graph. I found this site with this graph: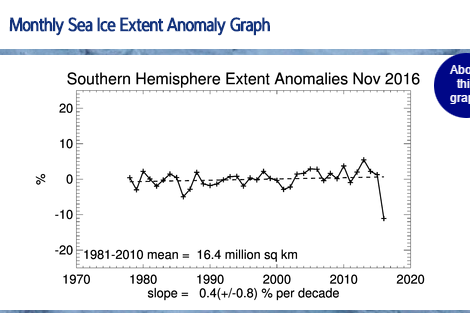 .
.
I guess maybe that's the data behind the global anomaly in the top level post.
To put it mildly, I'm suspicious of that last data point. I suspect an instrument malfunction. Check back in 6 months, and if it hasn't been corrected, then I'll start worrying.