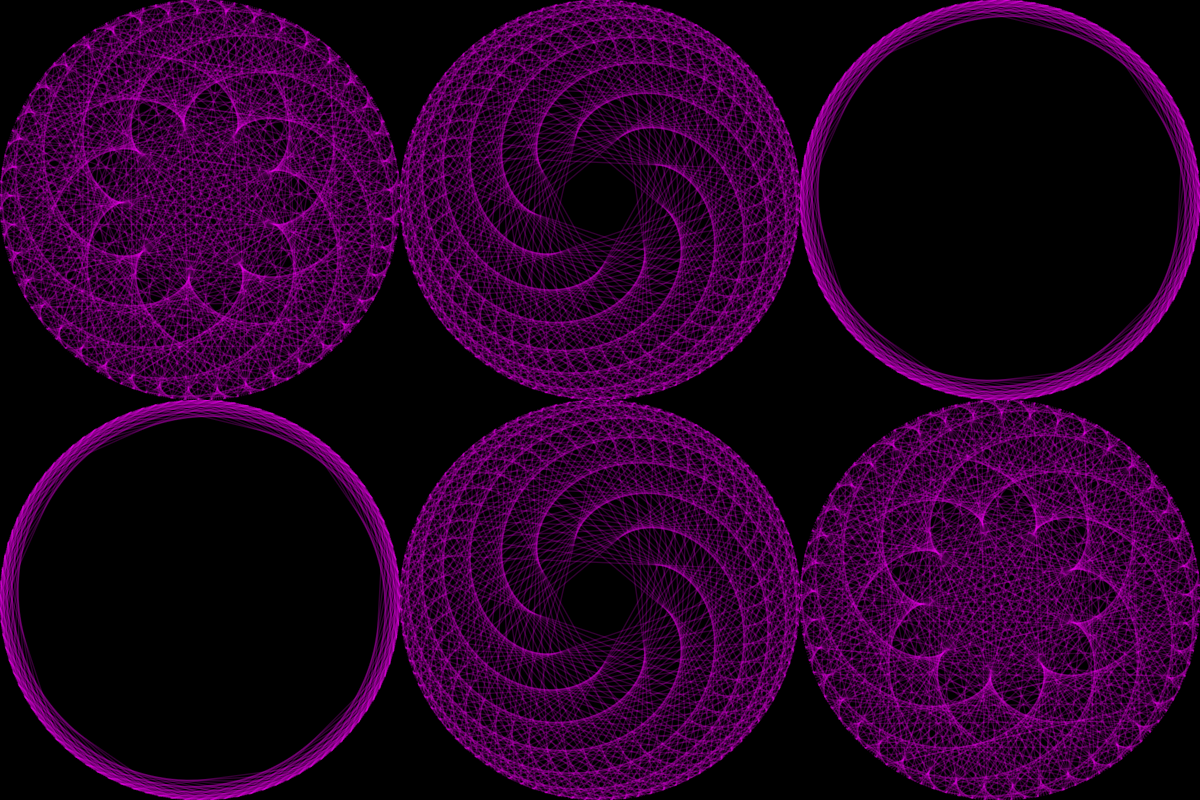
Mathematical Mandalas, Hidden Beauty of the Times Tables Part 2

This Gif was made with a program I wrote to visualize multiplication, If you'd like to read part one where I explain how these are made you can find it here.
So what's new?
In the previous post I was using static points to calculate the diagrams for whole numbers but I wanted to show how the transitions between the whole numbers occur. So I dropped the points and started to calculate where the result would be on the circle, this is 1 to 3 counting up by .01 every frame.

I deliberately used very few lines here to make it easier to see how the patterns are formed, as you can see each number 1 to 50 draws a line across the circle to the result of the sum (pointNumber * multiplier) % points. This results in 50 straight lines, one from each point, tracking round the inside of the circle. So as the multiplier gets higher every frame the distance between the ends of the lines spreads out as the higher numbers are moving round faster, that is what leads to these freaky patterns.
Thanks for reading, if you'd like a short gif making let me know and I'll try and get one up for you.
As always please feel free to write a comment. :)
Have you tried getting your program to create this as a real-time effect - something like demo-scene programs do?
Thanks for asking :) It does, I don't have any screen grab software bit I could get it to drop out PNG files for every frame so I made some gifs. I have it set currently to oscillate between a minimum and a maximum value, if you're interested I can post it to github tomorrow.
Soo epically trippy @.@
Nice job!
Thanks.
This work of yours is inspiring. I've been coding myself for almost a year now, and got really interested in Moire patterns, animated lines and shapes that create interesting forms, just like yours :)
Keep up the good work!