Infrared Spectroscopy - A Quick Guide
Infrared Spectroscopy

Image Source
To understand how this technology works and how it allows one to distinguish between different chemical substances, it is important to know about the very basics of molecular bonding strength. The atoms that build up molecules can connect with each other in different ways:
- direct covalent σ (and π) bonds, as in every organic compound
- direct coordinative bonding, like in complexes (e.g. cis-Platin)
- intermolecular interactions based on coulomb- or hydrogen-bonding-forces
The two first mentioned types in principle define the strength of a bond, other forces just influence them a little. But what does the bonding strength really say?
The Meaning of the Bonding Strength
The bonding strength of a bond refers to the amount of energy that was released when this bond was formed. Hence the higher the bonding energy, the lower is the overall system in remaining energy (“the more relaxed it is”) and the more stable the bond. Furthermore the bonding strength defines how flexible or rigid a particular bond is.
Since infrared spectroscopy is based on vibrational excitation of chemical bonds via infrared radiation and the measuring of the extinction of the radiation, it is now clear that different bonding strengths require different excitational energies, i.e. different wavelengths, thus giving different signals.
As already mentioned, the direct bonding types (covalent and coordinative) very much define the energy of a particular bond. This fact allows to roughly assign characteristic signals to specific atom arrangements:
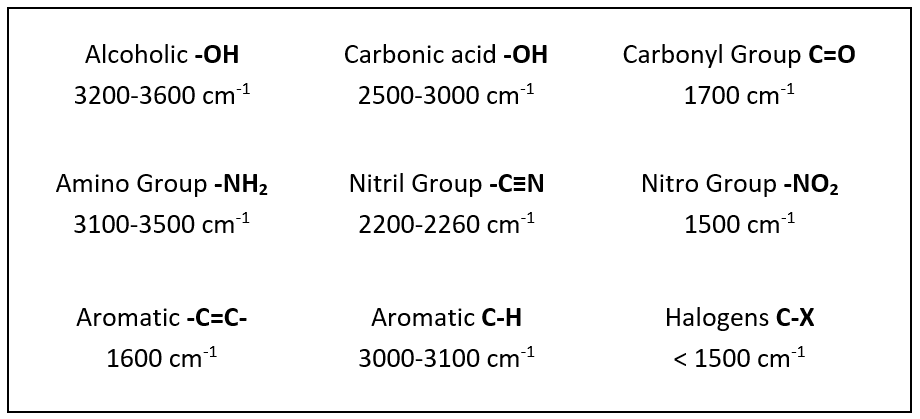
Characteristic signals - Ref. 2 and 3
For Infrared Spectrocopy it is common to use the Wavenumber [1/cm] as a measure for the energy of the radiation. The higher the wavenumber, the lower the wavelength, thus the higher the energy of the radiation.
Nonetheless the exact location of a signal depends on a lot of factors:
- atom types (elements) connected via the bond
- bond order (single, double or triple bond)
- chemical surrounding (neighbouring bonds, atoms and their spatial arrangement)
Since there are so many influences it is obvious that we can expect a set of different characteristic signals for different molecules. By means of IR interpretation tables, by comparison to data collected in IR databases (see later) and some additional information (e.g. elementary analysis results) it is possible to deduce the precise chemical structure from IR spectra.
Measuring IR Spectra
The next image shows one of the most commonly used standard IR devices. It is a so-called IR-ATR Spectrometer by Bruker. The abbreviation stands for Infrared-Attenuated Total Reflectance Spectrometer, what describes the way of the interaction between the sample and the infrared radiation. Although the utilized technology is quite complex, its operation is extremely simple:
The sample can be directly applied in solid or liquid form to the probe head, the ATR crystal. For a solid sample, e.g. a crystalline powder, the stamp is then pressed down to make close contact between sample and crystal. Subsequently, the measurement process is initiated via a digital user interface. After a few seconds of measurement the probe head is cleaned with a fuzz-free cloth and isopropanol.
.jpg)
"Alpha" IR-ATR Device by Bruker - Image Source
The interaction between the IR beam and the sample is explained as illustrated next. The use of an optically dense crystal and a suitable angle of incidence results in total reflection of the beam at the interface between sample and crystal. A so called 'evanescent field' is formed which allows interaction between sample and radiation.
In doing so, the sample absorbs wavelengths that can trigger characteristic vibrations in the molecule. Hence this leads to the weakening of specific portions of the incident IR radiation, which then can be detected.
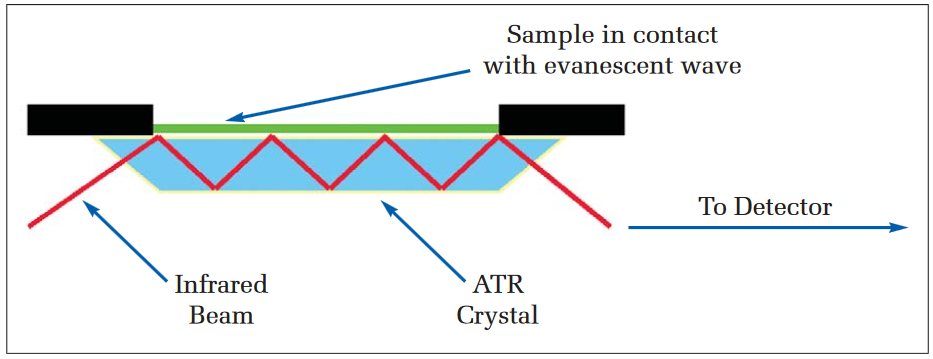
IR-ATR principle - Image Source
Interpretation of IR Spectra
For the qualitative evaluation of IR spectra one can use IR interpretation tables in which characteristic signals for chemical structural elements including their typical signal strengths (s = strong, m = medium, w = weak) are plotted. The next two pictures show the tables I warmly recommend.
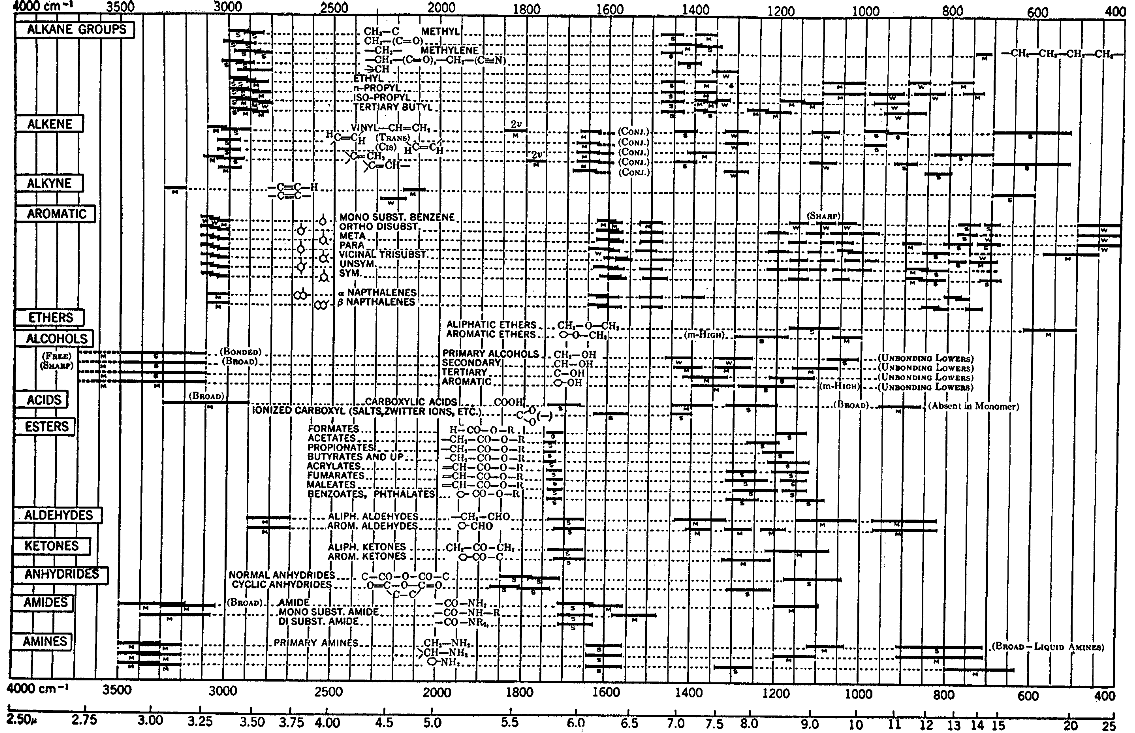
Interpretation Table Nr. 1 - Ref. 4
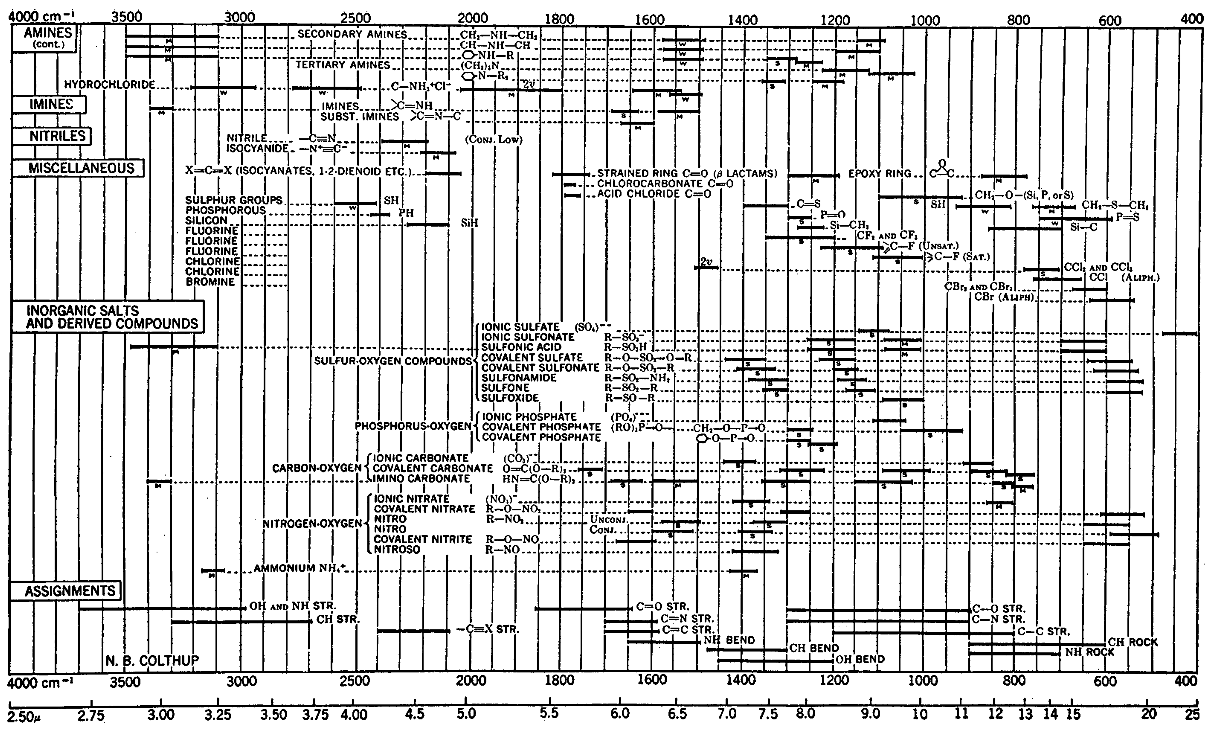
Interpretation Table Nr. 2 - Ref. 4
And now I want to show you how all this knowledge is applied. For this let's have a look a the following IR spectrum. To start with your interpretation primarily use the characteristic signals above 1000 1/cm. The lower regime is called 'Fingerprint Area' and is more important for computational comparison.
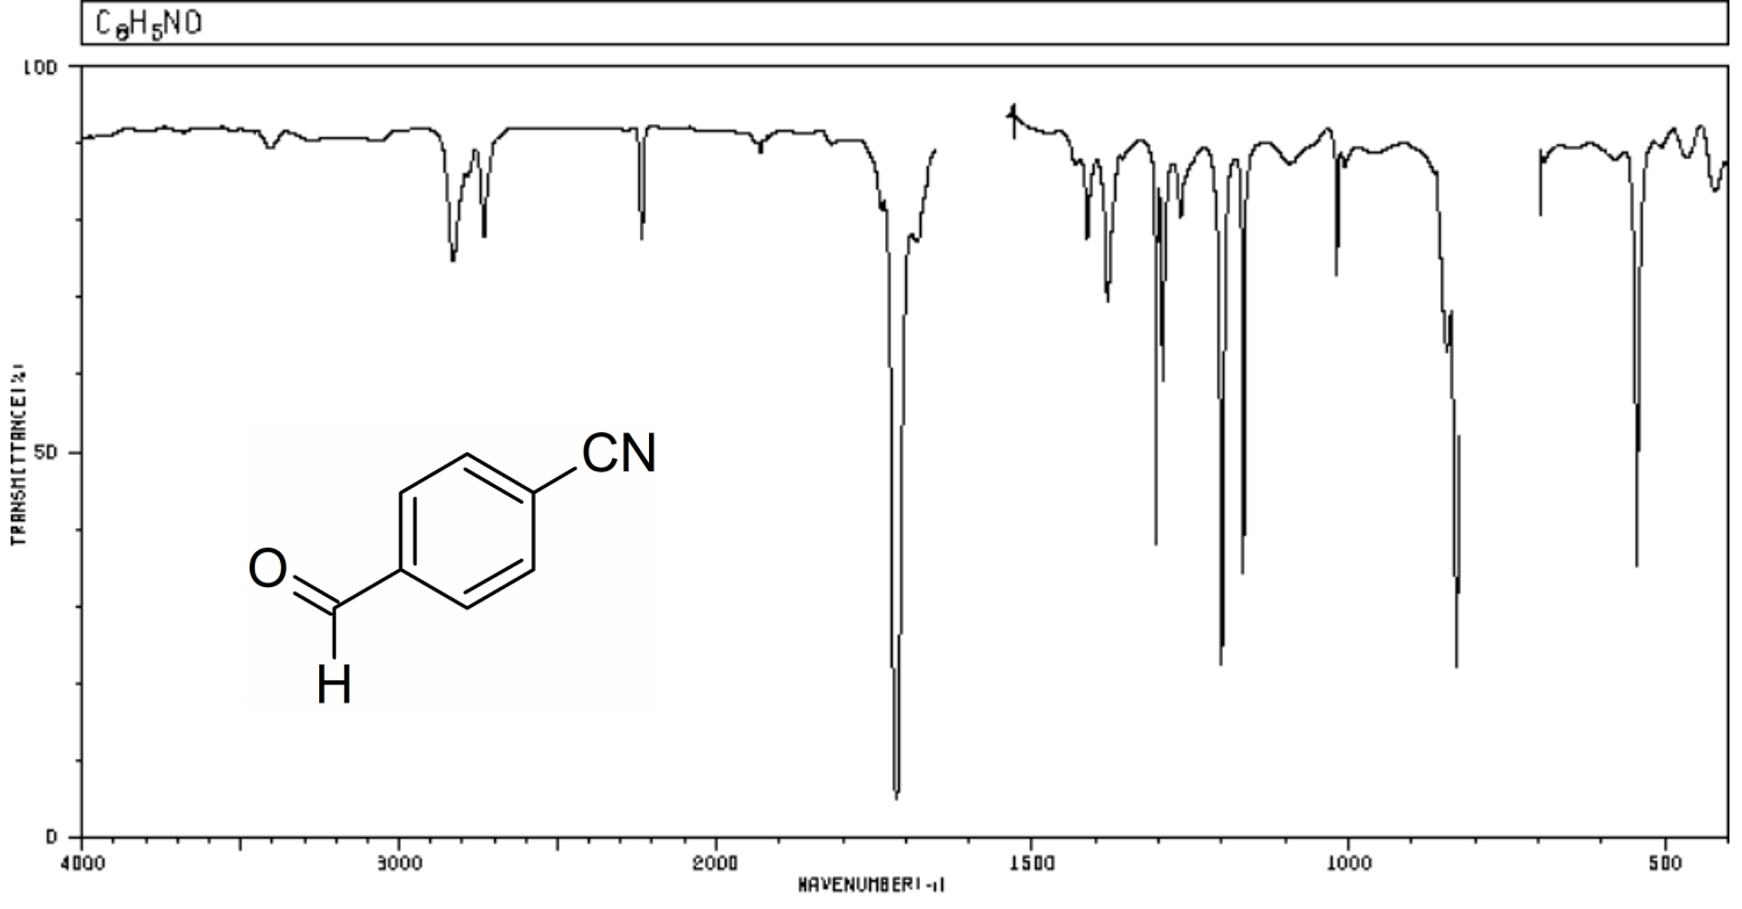
IR Spectra of p-Cyano-benzaldehyd - Image Source
Following characeristic signals can be seen.
(The letter behind the wavenumber refers to the signal strength.)
- 1710s indicates a carbonyl group: C=O
- 2250m indicates a nitril group: -CN
- multiple 3000m; 1200m, 1100m and 850s indicate a para-subsituted aromatic structure: -C6H4-
Now we use the given stoichiometric information from the top of the spectra (from elemental analysis). If we add up all assigned atoms we end up with C8H4NO, thus we miss one hydrogen. This tells us, that the carbonyl-group comes from an aldehyd an not from an ketone and that our molecule indeed is p-Cyano-benzaldehyd.
Finally here is one quite easy one for you to test what you have learnt. Feel free to write your suggestions in the comments! :)
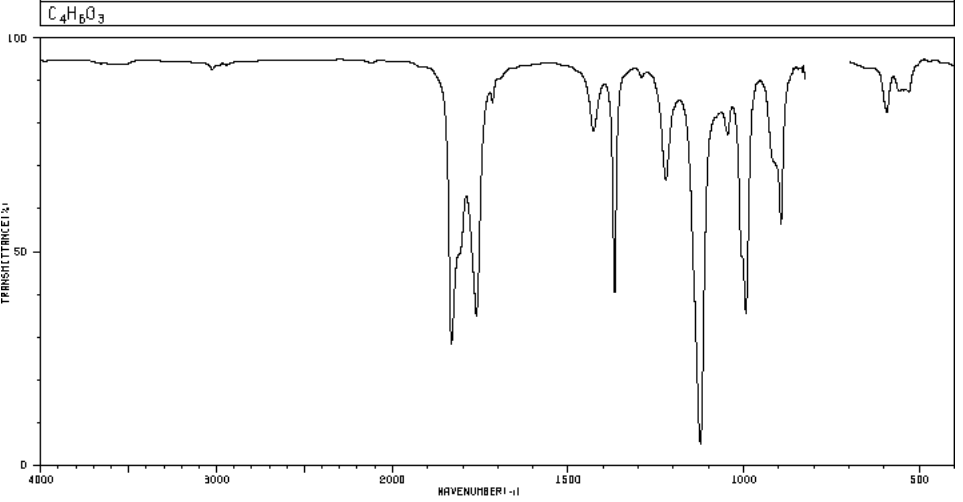
Guess the Compound! - Image Source
If you want to check for free accessible reference IR spectra, I suggest the following two databases. - I recommend searching with the CAS number.
mountain.phil28
References:
- FT-IR Spectroscopy ATR - A Technical Note
- H. Günzler, H.-U. Gremlich: IR-Spektroskopie: Eine Einführung. 4th Edition. Wiley-VCH, Weinheim 2003, p. 165–240. - indirect online accessible via Wikipedia
- R-Spektroskopie organischer Moleküle, Uni Stuttgart, accessed online 10th January 2018
- F. A. Miller's, Application of Infrared and Ultraviolet Spectra to Organic Chemistry, Gilman's Organic Chemistry, Vol. III, 1953, John Wiley and Sons, Inc.
Nice @steemstem
woohoo i do need a guid on how to..not lose her train of thought^^
You broke down IR so well :D
i must say, im like, loving the small measures your dealing with :D ha ha
I'm glad you like it. :)
"small measures"... To what are you refering here?
Happy reading :D what i mean is, in my world IE is the smallest mesure we use :) I never get anyyyyy were close to molecys athoms ;) cm-1 aint on my world map, thats all :D
Ahhh enlighted. 🤗