Particle physics on Steemit - Playing with Feynman diagrams
The calculation of the production rate of any system of elementary particles is crucial in particle physics. Richard Feynman (1918-1988) invented a diagrammatic way to handle this, which looks like assembling pieces of a puzzle.


[image credit: flickr, slice of MIT]
In my first particle physics post on particle physics, I introduced all the basic ingredients whose particle physics is after.
In this other post discussed the Standard Model Lagrangian, the object describing the way all elementary particle propagate in spacetime and interact with each other. I now discuss Feynman diagrams and the calculations which they are connected to. The table of content of this post is:
- Particle physics calculations in a nutshell
- Introducing Feynman rules
- From Feynman rules to Feynman diagrams
- Dominant and subdominant diagrams
- Life in a roller-coster: what about loops?
- Two small exercises, for the fun
- Proton collisions
- Algorithms, computer codes and myself reloaded
Note: there is a challenge in section 6 and I provide a link to a free particle physics computer code :)
 [image credit: APS]
PARTICLE PHYSICS CALCULATIONS IN A NUTSHELL
To fix the ideas, I will concentrate on the production in a proton-proton collision of a system comprised of a top quark and a top antiquark (see the above picture). I recall that a top quark is the heaviest quark known. How to compute the production rate of a top-antitop pair at the Large Hadron Collider?
First, we do not really care how the top-antitop pair is produced, the energy the two particles have, if they dance the rock-and-roll or eat a nice piece of steak. It is sufficient for us that they are produced.
Then, it is enough to translate this into an equation:

I promise this is the only equation of this post :)
We need to calculate the cross section (the sigma symbol), and for the rest :
- The integral means that we are considering all options for the final state (I recall that our top-antitop particles can dance) .
- The summation and the 1/F factor (roughly) means that we are considering all options for the initial state too.
- The matrix element M contains the physical processes. This is the key quantity to calculate.
INTRODUCING FEYNMAN RULES
Feynman proposed a diagrammatic way to calculate the matrix element: we can draw fancy diagrams (named Feynman diagrams) that represent the process under consideration.
These diagrams are coming with rules that allows particle physicists to connect the diagrammatic approach to the equations. If we take our Standard Model Lagrangian (the equation on the t-shirt shown on the first picture of this post that contains all the Standard Model physics), manipulate it a bit, we can derive a reduced set of building blocks for the Feynman diagrams:

This contains all existing Standard Model interactions, and each boson has its own set of interactions: photon (1st line), Z-boson (2nd line), W-boson (3rd line), gluon (4th line) and the Higgs boson 5th line).
How to read one of these interactions? Let’s take the first rule as an example (first line, second column).
This consists of the interaction of a quark-antiquark pair (any of the 6 quarks) or a lepton-antilepton pair (any of the charged leptons) with a photon. The photon is drawn as a wavy line and the other (matter) particles as straight lines with an arrow. A forward arrow means a particle and a backward arrow means an antiparticle.
Finally, the red-blue-brown color code is connected to the strengths of the different interactions
- The red interactions stand for the strong interactions of the quarks and gluons and dominate all the other interactions. The quartic gluon interaction has a larger red dot compared to all other red dots. The reason is that the interaction strength is here twice the other strong interaction vertices.
- The blue interactions are connected to electromagnetism and the weak force (or the electroweak force). And you got the idea for the big blue dot for the quartic W-boson vertex.
- The brown interactions are also electroweak interactions, but they involve a Higgs boson and are thus enhanced by the mass of the particle. This is particularly true for the top quark, and the W and Z bosons.
FROM FEYNMAN RULES TO FEYNMAN DIAGRAMS
Now, how to draw a Feynman diagram from the set of Feynman rules above?
Easy: with the help of the building blocks, we connect the initial-state to the final-state particles. We can use each building block as much as needed and rotate it if necessary.
Within our example, we are interested in the production of a top quark and an antitop quark. For clarity, we consider an initial state made of an up quark and an up antiquark:
up + antiup to top + antitop
and since strong interactions are stronger, one restricts the exercise to the 'red' Feynman rules.
How to get a complete Feynman diagram describing it? It is actually very easy.
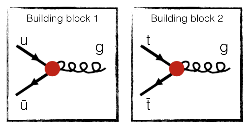
- One observe that there is only one single strong interaction that involves quarks and antiquarks: the quark-antiquark-gluon vertex (the first interaction of the fourth line). And we have one such vertex for the up-antiup and for the top-antitop:
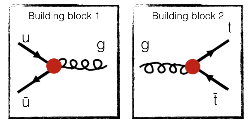
- We need to connect those blocks. Rotation helps:
- Now, we can glue them together:
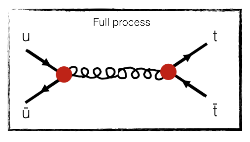


We are done! We have found one (and actually the only one) Feynman diagram describing the process of interest, under our assumptions.
DOMINANT AND SUBDOMINANT DIAGRAMS
The diagram above includes two strong interaction vertices (red dots). Any other choice to connect the initial to the final state would have involved electroweak interactions (blue or brown dots), as for instance with a photon instead of with a gluon:

This very valid photon diagram is however subdominant compared to the gluon diagram above.
If a given process can occur both via strong interactions (in red) and electroweak interactions (in blue), the former dominates and the latter can be safely ignored. This is why the strong interaction is called as such.
It is therefore sufficient to concentrate on the class of diagrams that will contain the largest number of red dots and the smaller number of blue/brown dots and draw all possible such diagrams.
If only one (even out of 1000 possible diagrams) is missing, the results is wrong. It is like being pregnant: one cannot be partially pregnant; the result is either correct or totally wrong.
In the up + antiup to top + antitop process above, the first diagram we have found has two red dots. It is depending twice on the strong interaction. Therefore, we can forget any diagram in which there is less than two red dots. And remember: the larger dots count twice.
LIFE IN A ROLLER-COSTER: WHAT ABOUT LOOPS
 [image credit: how stuff works]
What about the diagrams below, describing the process electron + positron to muon + antimuon:

It is pretty easy to construct the first diagram following the explanations above. However, one may also construct tens of diagrams with one or more than one closed loop inside, two examples being shown above.
Perturbation theory saves us from drawing an infinite number of diagrams (with 0, 1, 2 ... 1000 loops). The strength of an interaction (a blue, red or brown dot) is always smaller than one, so that loop diagrams containing more interaction vertices are small, compared to diagrams without any loop, and can be omitted. If g denotes an interaction strength smaller than one, then
g > g * g > g * g * g > ...
In addition, loop-diagrams give rise to infinities that must be treated appropriately, which is not very easy. For precision predictions, loops are however needed. But this clearly goes beyond the scope of this post.
Loop diagrams can therefore be omitted in a first approximation
TWO SMALL EXERCISES, FOR THE FUN
Using the Feynman rules above, let us draw all gluon + gluon to top+antitop Feynman diagrams.
Hint: there are several dominant diagrams and they all contain two strong interaction vertices.
And the answer is here. You need to click to find it.
The important point to notice here is that the position of the 4 particles in the diagram is fixed and cannot be changed.
And now for the fun, a challenge. Could you draw all diagrams for the gluon + gluon to top+antitop+Higgs process?
Hint: the dominant diagrams contain 2 strong interaction vertices and one electroweak vertex with a Higgs (the brown guys in the Feynman rule table above). You can try to answer the challenge by commenting this post.
PROTON COLLISIONS

At the Large Hadron Collider, we are colliding very energetic protons. In this case, it is the proton constituents that interact, the proton being broken into pieces.
In my bestiary post, I have described the proton as made of two up and one down quarks. This picture does not hold at high energy.
The proton is a dynamical object where gluons are exchanged between quarks (they strongly interact with each other) and possibly converted into a fresh quark-antiquark pair. This is represented in the figure above.
When drawing the Feynman diagrams associated with a proton-proton collision process, one must hence consider all possible initial state made of any two of the proton constituents (up, down, strange, charm, bottom, gluons) and sum them over.
ALGORITHMS, COMPUTER CODES, AND MYSELF RELOADED
To perform a cross section calculation (which is the sigma in the equation at the very top of this post), we:
- Define all possible subprocesses with different initial states (in the case of a proton-proton collision).
- Draw all possible Feynman diagrams for each subprocess.
- Replace the Feynman diagrams by their analytical expression that originates from the Feynman rules.
- Calculate the integral.
All these steps are very suitable for computers and one could design an algorithm that takes care of that.
There are several programs on the market that allows you to do it. All these programs are free and can be downloaded from the web (one example here).
The level of automation of these codes is such that it is sufficient to type in the process of interest, press enter and wait. After a couple of seconds, thousands of LHC collisions can be simulated into all their nasty details and analyzed.
And developing theses codes is part of my work. To make a ten-years story short, I have developed with a couple of colleagues and friends a comprehensive way to change the particle physics model (which is the same as using another table of Feynman rules) and to analyze the simulated collisions.
SUMMARY
In this post, I have introduced the concept of Feynman diagrams and Feynman rules and have shown how they can be linked to practical calculations. I have also described how to use them through some examples.
I hope you had as much fun in reading this post as me in writing it.
The Big Bang Theory is on steemit :-)
Believe it or not...I was going to write a post on Feynman diagrams, focusing on their graphical/aesthetic impact (no attempt to explain physics...too lazy for that), when I saw your post :-)
Im not sure I can locate the python files in the repository. can you please elaborate @lemouth?
You can check the link here which is given in the chapter before the summary. I have also given some lectures (at CERN) on how to use this tool, if you are interested.
well, I'm more curious than interested at the moment. I'd be more interested if I could somehow contribute or be more involved :-/
Then you may have to wait for my next (to next to next) post :)