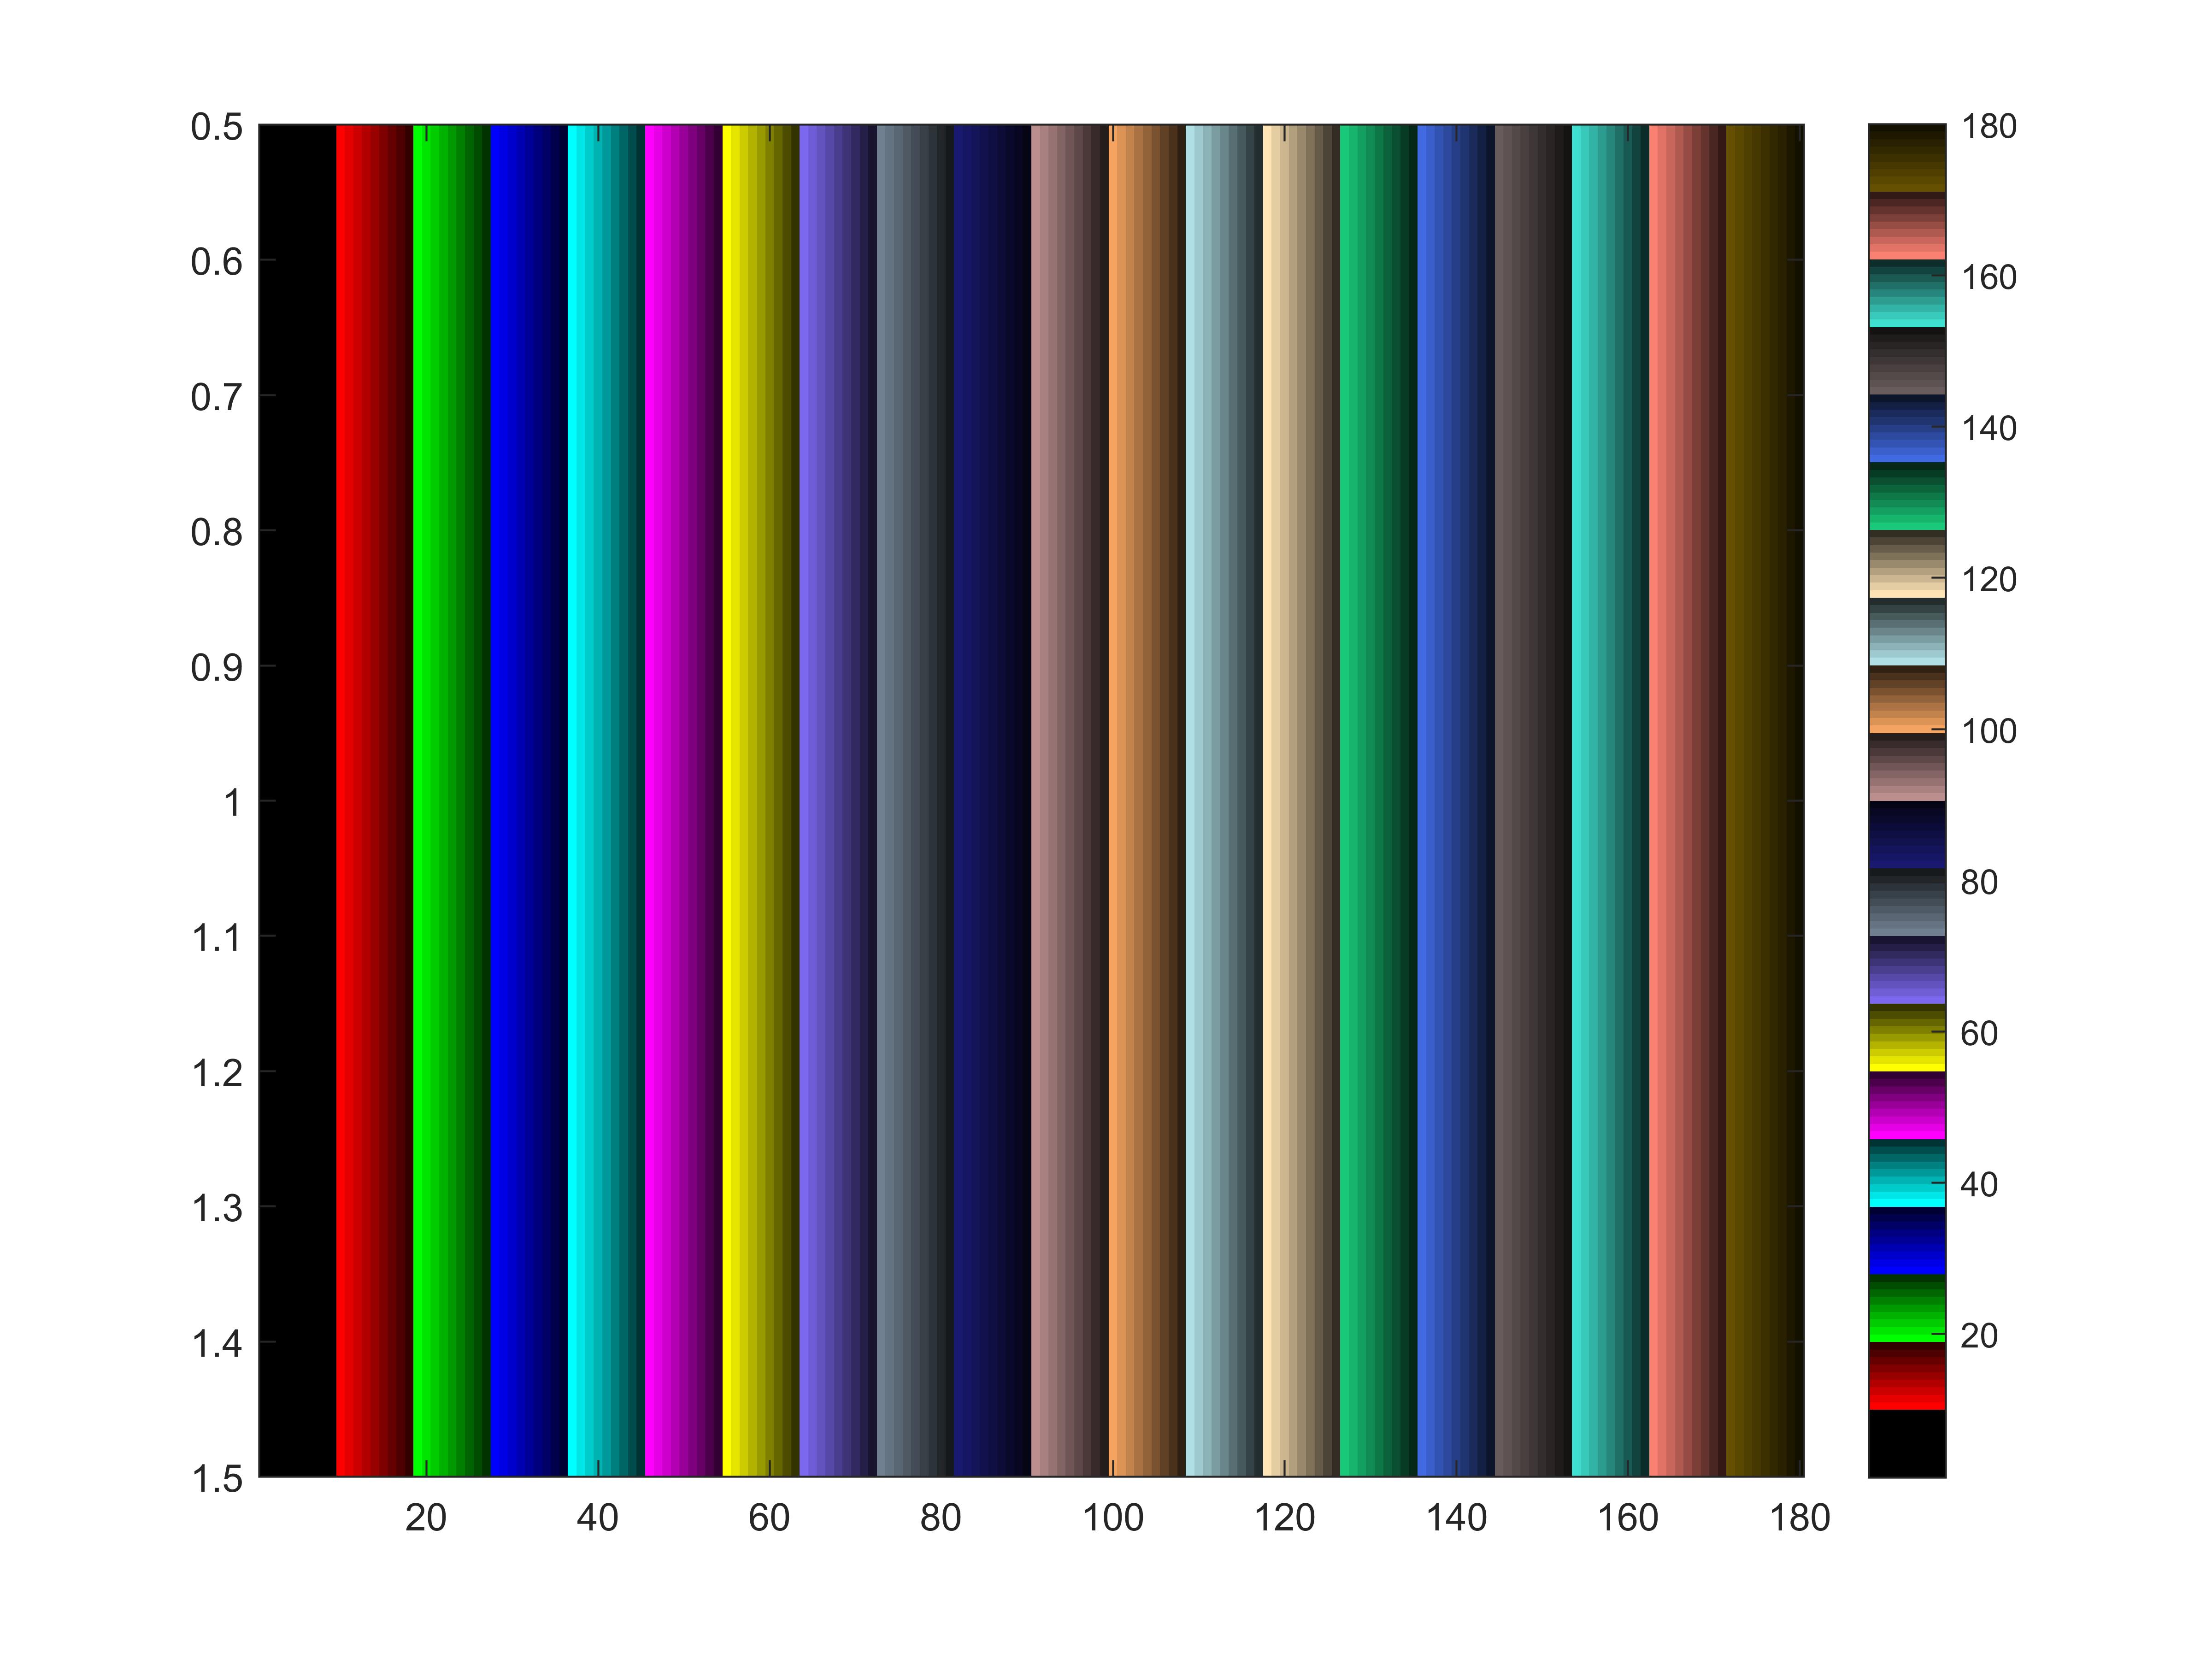
Map of colors using Matlab
Hello everyone, most of my post in this wonderful community have been basin attractions, ie post of this type: https://steemit.com/science/@falcao12/the-method-of-newton-and-Basins-of-attraction.
I want to tell you a little about the procedure that is used to obtain wonderful images as well as a map of colors created by me to be able to guarantee optimally the dergradacion of the colors
The procedure used here to obtain the bases of attraction of the simple or multiple zeros of f using a numerical method is summarized as follows:
• Step 1: Enter the function, derivatives and parameters according to the numerical method to use.
• Step 2: Enter the real roots of the function entered in Step 1.
• Step 3: Partition the closed interval [a, b] and [c, d] in N and M equally spaced points respectively and perform the Cartesian product [a, b] × [c, d] to obtain N × M points in The complex plane, that is, points of the form x0 = u + iv where u ∈ [a, b], v ∈ [c, d] where i =
√-1.
• Step 4: Take each x0 of Step 3 as the starting point of the selected method and predefine, a maximum number of iterations (Niter) and a tolerance for the absolute error committed when calculating the various approximations of α.
• Step 5: Assign a different color to each x0 of Step 4 according to its convergence to the roots introduced in Step 2, if the method exceeds the value of Niter without satisfying the tolerance this will be taken as no convergence or slow convergence and Will be painted in a color different from that selected for the convergence of roots.
• Step 6: Graph what you got in Step 5.
Remarks: In Step 3, the values of {a, b, c, d} must be selected taking into account the location of the roots introduced in Step 2. Note that in step 5 Nr + 1 colors are needed, where Nr denotes the number of roots of the function.
The next procedure is of great importance because it allows us to create an array of up to 20 colors, with different shades in RGB format, this code is described as follows:
Line (8-13) It is valid that the number of colors does not exceed 20, since here we work with a base of 20 different colors, but this can be changed simply by adding or removing colors in RGB format according to what Is required, likewise validates that the degradation is a number between 0 and 1.
Line (14-18) A matrix is constructed with a total of 20 colors divided into primary, secondary and other additional colors. In this part you can mix, remove or add colors at convenience.
Line (22-25) A matrix is created in such a way that in its odd positions it represents a color of the previously obtained color matrix and its immediate even positions are the degraded color certain percentage between 0 and 1.
Line (30-37) Values are interpolated between the odd position and its immediate even position of the matrix obtained in the previous part, according to a predefined number of shades. This gives us an output matrix that has as many shades as required between the color and its respective degradation.
In figure (1) we can see 20 predefined colors with a degradation of 0.2 and a total of 9 shades

Enjoy and follow me @falcao12
good effort,god bless you,i will support you in your future posts,I just vote you