Electrocardiogram signals
Hello all my friend, I want talk about my research in Electrocardiogram signals:
According to Mcsharry et al. (2003) each heartbeat can be observed as a series of deviations away from the baseline on the ECG. These deviations reflect the temporal evolution of the electrical activity of the heart, which initiates muscle contraction.
A single sinus (normal) ECG cycle, which corresponds to a heartbeat, is traditionally labeled with the letters P, Q, R, S, and T at each of its inflection points called fiducial points. The ECG can be divided into the following sections:
Wave P: A small baseline low voltage deflection caused by the depolarization of the atria before the atrial contraction resulting from the superposition of depolarization of the right atrium (the initial part of the P wave) and the left Of the P wave).
Interval PQ: The time between the onset of atrial fibrillation and depolarization.
QRS: The largest portion of the ECG amplitude, caused by the currents that are generated when the ventricles are depolarized prior to contraction. Although atrial repolarization occurs before ventricular depolarization, the last waveform (ie, the QRS complex) is of much greater amplitude and atrial repolarization is therefore not observed on the ECG.
QT interval: The time between the onset of ventricular arrhythmias the depolarization and the end of ventricular repolarization.
Interval ST: The time between the end of the S wave and from the T wave. Significantly elevated or depressed baseline distance amplitudes are often associated with heart disease.
T wave: ventricular repolarization, by which the heart muscle is prepared for the next ECG cycle.
Mcsharry et al. (2003) have proposed a synthetic ECG generator, which is based on a non-linear dynamic model. This model has several parameters, making it adaptable to many normal and abnormal ECG signals. The dynamic model consists of a three dimensional state equation, which generates a path with the coordinates (x, y, z).
dx=alpha x-w y
dy=alpha y+w x
dz = -(z-z0)+Sum of Normal Distribution over the set (P,Q,R,S,T)
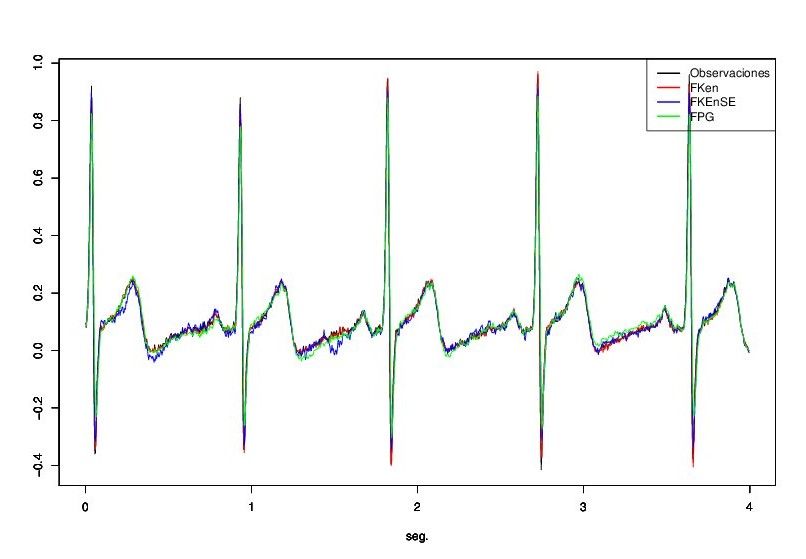
1000 observations were taken from the MIT-BIH Normal Sinus Rhythm Goldberger et al.(2000), with a sample period of r = 0.004, subjects included in this database had no significant arrhythmias. For the recontruction of the signal of the Electorcadiograma the technique of Bayesian filtering was used
The estimated values were compared with the simulated values, it was observed that they had a good performance in the ECG signal reconstruction. In the case of the actual electrocardiogram data, a patient database with no pathology and pathology was used, in both cases the filters reconstructed the pattern of the beats and filtered the errors associated with the measurements of the observations.
What do you think? it is amazing no?
Follow me @falcao12
.jpg)

