A RESPONSE TO BELIEVERS OF MANMADE CLIMATE CHANGE ON FACEBOOK
So, I shared a video the other day on Facebook that disputed the claim of 97% of scientists or climate scientists agree regarding man-made global warming or man-made climate change. Take your choice. For the most part, the response was one of agreement though a couple of people did take umbrage with the discreditation of their belief and rather than attempt to prove their case, they instead resorted to attacking my character, demeaning me by association, which is essentially bullying, and regardless of how often I implored them to "speak me some science", all they had to share was hyperbolic propaganda. What I found truly disheartening in this, is that one of the respondents is someone I have known online for some time and she is of the nature to speak out against bullying and would defend those being bullied, yet here she was, unaware that she was using the language of bullying to get me to conform to her belief.
One of their most common dismissals was to allege that I was "misinformed" by some oil company agent and to top it off, they dismissed any research they considered to be funded by oil companies without looking at the data. This act is, of course, the height of ignorance and speaks volumes about the ideological roots of their belief. I have run across others of this ilk using similar excuses of dismissal. I recall one person saying the site I got my data was a "denier" unaware that I could claim the same about the site where they get their data. That such a claim is one of a biased ideological perspective and is not objective, rational or logical. If this is your means of analyzing a paper, it suggests you are not capable of judging the data so you judge its source and because they disagree with you, you dismiss it. Anyone truly interested in knowledge and truth follows the data regardless of where it leads. I personally have no issue with changing a belief when data challenges it and have done so many times. In fact, if I am wrong I want to know so, so I can then be right. My drive is curiosity pure and simple.
The fact is that while certainly, I have leaned on the research of scientists who dismiss the pseudoscience of the IPCC, I also check the raw satellite data regularly. In other words, I observe in real time the data that represents the state of the climate today. I do not rely on the hyperbolic propaganda of the mainstream media to base my understanding of climate or my belief, as I have found their climate journalism does not match the raw data and the same is true of the IPCC Policy Maker Reports, which have caused a few lead authors of the IPCC, such as Dr Judith Curry, to jump ship. One lead author whose name I cannot recall at this writing even published an apology for spreading IPCC pseudoscience after he looked into the science itself and saw what a crock it is. So, what does the raw data say about the state of the climate today?
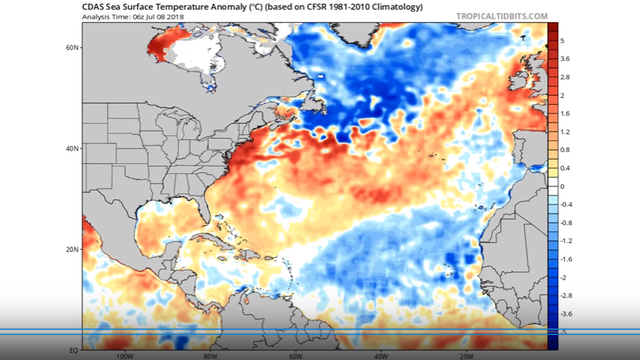
In this image above we can see surface temperatures and take note that while over land masses things are warmer and some places are experiencing a drought(not uncommon during Grand Solar Minimums for summers to be short but very hot) at the moment, and equally so over the equatorial zone we see it is warm as is expected for this is the Equatorial Electrojet and the highest amount of solar energy is directed here. In the northern Atlantic, it is not so, and it is these cool waters pulsing under the Arctic ice that will slow its summer melt. And as for the Arctic ice, what is its status? Is it melting away as the mainstream keeps on bellowing?
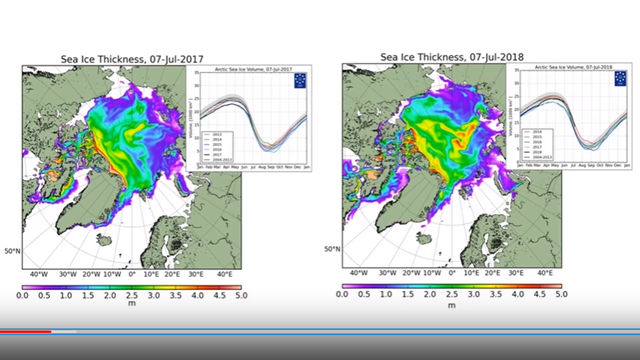
In this image above taken from the Danish Meteorological Institute, it shows a comparison between Arctic Ice in 2017 to 2018 and what we can clearly see is that there is more ice and it is thicker ice. Take note of just north of Russia/Europe there is a patch of red indicating ice thicker than four metres(12 feet) that were not there last year and furthermore, there is an increased volume of ice thicker than 3 metres. This comparison clearly shows that ice is increasing and while it is not a lot it is significant enough to show a trend especially if one takes a look at the multidecadal average.
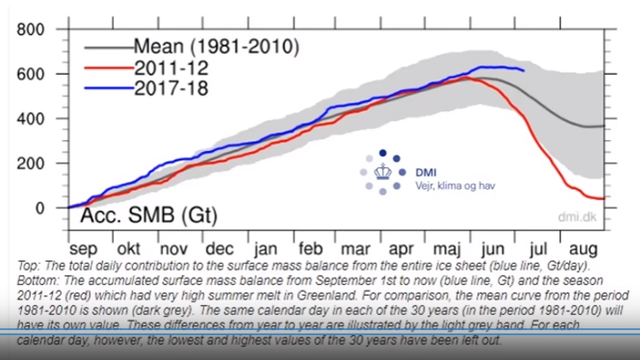
In the above graph, we can see clearly that the Arctic ice volume has eclipsed the multidecadal mean of 1981-2010 and is showing a trend towards increasing in volume. Can we state assuredly that it will continue on this trend? Of course not, though all indications suggest that it could and very well may and based on what we see, I predict it will continue to increase.
I AM NOT going to waste my time showing why man-made CO2 did not cause the warming of the 20th century as I have done that many times and it just take up too much space and time. But I will say it is not the first time such a warming has occurred. Approximately one thousand years ago(+/-) during the Medieval Warming Period there was a similar warming which resulted in an increase in Europe's population that was then decimated during Europe's slide into the Dark Ages and would not reach those numbers again until the late 1800s. Go back another thousand (+/-) to the Roman Warm Period and you find a similar warming which accompanied the growth of the Roman Empire.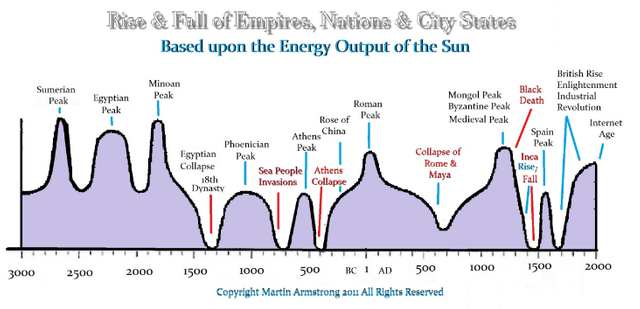
This graph by Armstrong Econmics takes it a few steps further and shows the rise and fall of empires around the globe correlated to solar maxima and solar minimas. And what makes this even more interesting, is, that as an economist they want to know the truth to be able to profit from the trends they see. They are recognizing the correlation between the sun and Earth's climate.
IT IS THE SUN that drives climate on Earth coupled with planetary positions and therefore it should be no surprise that this is indeed a cyclical pattern. There are the millennial cycles known as the Milankovitch Cycles and within that, there are many other cycles. thousand year cycles, two hundred year cycles, sixty-year cycles, twenty-two-year cycles, eleven-year cycles and this is by no means a complete list of the cycles within cycles that define climate on Earth. And quite frankly, to believe that man in a mere century could disrupt the cycles of the solar system is nothing short of hubris.
The IPCC dismisses the sun and claims there is little deviation in its total irradiance, yet they totally ignore sunspots, filamentary eruptions, coronal holes and CMEs. All these solar events when geoeffective send increased amounts of energy toward the planet as can be seen by brighter than average Auroral events. The Carrington Event of 1859 which set telegraph cables afire by induction lit up the night sky so brightly that one could read a newspaper at night. Such energy will heat the atmosphere and the 20th C was such a period of increased solar activity of this nature and so caused the climate of the earth to warm. And because of this, I have decided to call it 'The Modern Warm Period'.
ERGO CYCLICAL GLOBAL WARMING WAS REAL BUT IS ALSO NOW OVER
By all accounts, we are in a global cooling part of the climate cycle and this may well last for decades and according to many solar physicists, it will. In fact, they have already defined it as a Grand Solar Minimum and named it 'The Eddy Minimum'. 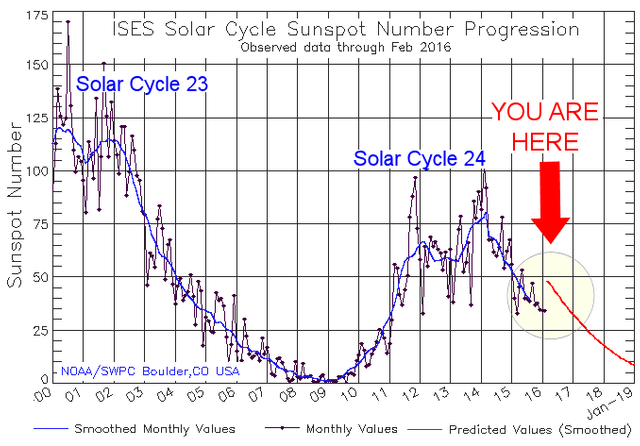
In the above graph we have the sunspot count over a nineteen year period showing the monthly count and the smoothed monthly count and what should be obvious right away is that Cycle 24 did not peak anywhere near Cycle 23 and the general consensus of solar physicists is that Cycle 25 will be either as low or even lower.
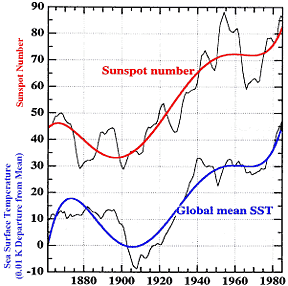
The above image shows a very strong correlation between sea surface temperatures and sunspots. There are a number of these graphs out there that show a strong correlation between global mean temperatures and sunspots and what one should remember regarding these sunspots is that they are as large as or even larger than the earth. And the sun is a million times larger by volume. And again I reiterate, to believe that humans have the power to overcome such a behemoth as the sun is sheer hubris.
So, why is the sun going quiet and outputting less energy? Zharkova et al, while researching the dynamo of the sun discovered that there are actually two dynamos in the sun. One on the surface and one that is internal and what they discovered quite accidentally is that these two dynamos are going out of phase. Well, actually they are out of phase and are going further out of phase over the next couple of years. If you do not know about waves then I will explain as simply as I can; when they are in phase with the same highs and lows they add to the total output; when they are out of phase with opposing highs and lows they cancel each other out and thereby reduce their output.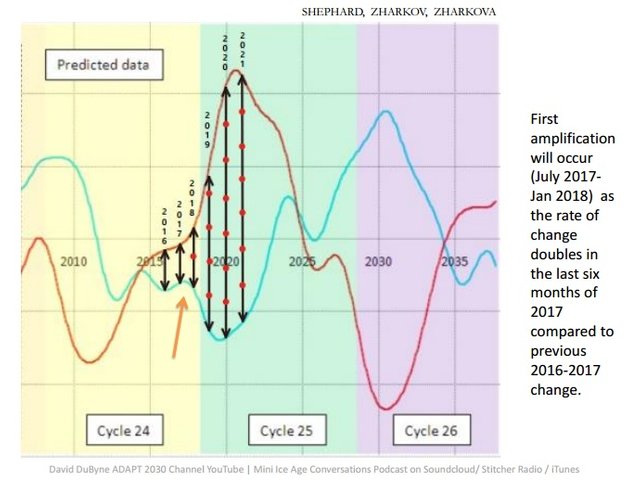
What the graph reveals is that over this year we will see a fourfold quieting of the sun's output as the two dynamos out-of-phase state increases fourfold. We have seen the results of this with the increased number and size of hail crashing down globally. The long winter that did not seem to want to end with the extended freezing causing crop losses globally. Snow in Newfoundland after the summer solstice. Snow in the Sahara two years in a row. Winter hit Australia weeks early and is one of the coldest on record. And I predict based on this that summer will be hot but short, fall will be practically non-existent as harsh winter conditions come early. I predict England to once again get battered with more cold temperatures not seen for over a century. And more and more crop losses driving up food prices threatening the well being of those in poor countries who simply cannot absorb the increased costs.
This is why I do this. I see a clear and present danger to human life. England saw an increase in death over the past two winters by tens of thousands. Honestly, they were not and are not prepared for such severely cold weather, they haven't had to be until now. If you are not doing something now to ensure your food security, you are putting yourself at risk in the years ahead.
All the information and data shared here does not come in any way from anyone associated with the oil industry. I would like to thank Diamond form the Oppenheimer Ranch Project, David Dubyne of Adapt 2030, David Dilley, John L. Casey, Henrik Svensmark, Habibullo Abdusamatov, Zharkova et al, Dr Judith Curry, Dr. Tim Ball and the many others who endure scorn and abuse who have all contributed to this post in one way or another and are independent scientists or independent journalists whose only desire is to seek the truth.
Thank you for reading. If you would like to see more posts like this please feel free to follow me. Leave an interesting comment or question and I shall follow you.
This post was written by Freddie Thornton of Global Warming - The Climatic False flag
PEACE
@daemon-nice