A fraternal feud: science vs. expertise in a fantasy movie league
My brother just finished his graduate degree in film production, and I’m coming close to completing mine in neuroscience. When he asked me if I wanted to join a fantasy movie league, I couldn’t pass up the opportunity to pit my beloved science against his film expertise.
The league works like this: each week fifteen movies are listed as choices. Your goal is to make the most money based on how movies that you choose perform in the box office over the following weekend. Your job is to fill 8 of your theaters with any combination of the movies. However, there is a catch that makes the task less simple. Each movie that you select costs some amount of “FML bucks.” That way, you can’t just fill 8 of your theaters with the single movie that is expected to perform the best. You have 1000 FML bucks in total to spend. You also incur a -$2,000,000 penalty for each theater that you leave blank.
I don’t know anything about movies, so the first thing to do was to find some source that did. From a quick search, I found a few options. Boxofficeguru has lots of information about the movies (TLDR), and also information about how well movies performed the previous weekend. Boxofficemojo is even better because it gives you the % change in performance over time. However, it still didn’t give me good predictions for the expected profits of new movies in the box office. I decided on going with Boxofficepro because every Wednesday it publishes a list of predictions for weekend grosses of the top 10 movies, which is enough to extrapolate the worth of the other 5 movies using their price in the movie league. I might try building my own predictor in the future, but this is a good and quick first shot.
Now that I have my predicted prices, it’s time to abstract the problem so that we can use math! For this example, I’m going to reduce the number of possible of movies to 2, so that we can visualize the problem on a graph. The variable “x” will represent the number of selections of a first made up movie, “Mr. Baxter,” and the variable “y” will represent the number of selections of a second made up movie, “The Birds on Springfield.”
To make things simpler, let’s say that we have 12 FML bucks to spend total, and that we need to fill 4 theaters. Let’s pretend that according to Boxofficepro, “Mr. Baxter” is expected to make 3 million and “The Birds on Springfield” is expected to make 2 million over the weekend. “Mr. Baxter” costs 2 FML bucks per theater, and “The Birds on Springfield” costs 4 FML bucks per theater.
Okay, so let’s first set up the optimization equation. We want to maximize the equation 3x + 2y. The total profit that we earn is equivalent to 3 million times the number of "Mr. Baxters" plus 2 million times the number of "The Birds on Springfields". Of course, the ideal solution would be to have an infinite number of both of these movies, but we have pesky constraints to recon with.
The first constraint is the total number of theaters that we can fill. We can represent this constraint as:
x + y <= 4
That says that the total number of "Mr. Baxters" plus the total number of "The Birds on Springfields" cannot be greater than 4. Let’s graph that equation. If you remember your algebra, you will recall that we can represent one variable in terms of another, by subtracting one of the variables on each side of the equation.
y <= -x + 4
This is convenient because it is common to learn “y-intercept form” for graphing linear equations in school. To review, this form is written as y = mx + b, where b is the y-intercept (where the line crosses the y-axis), and m is the slope of that line (the change in units of y for each unit of x). The slope is sometimes taught with the mnemonic “rise over run”. In our example, 4 is the y-intercept, and -1 is the slope.
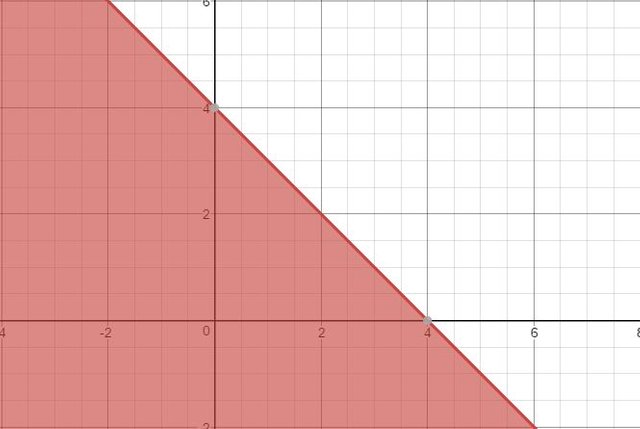
Let’s take a second to examine this graph. First, observe that, while negative values for x and y are legal according to the way that we wrote the constraint, they are not legal in reality. We should technically add other constraints that say that x and y are both greater than or equal to 0. We cannot choose a negative number of movies to fill our theater. Notice the importance of this seemingly obvious fact. We could have included -2 “Birds on Springfields” and 6 “Mr. Baxters” to fill a total of 4 theaters if it were possible, and that particular movie combination would make us more money. Luckily, graphing can help us notice the details that we sometimes miss, especially when they seem so obvious.
Focusing on only the area of the graph where x and y are positive, we see our new range of possible combinations. Each coordinate on the graph represents a possible x and y combination. For instance, if we have 0 “Mr. Baxters”, we are allowed to have up to 4 “Birds on Springfields”.
You may have now noticed another hidden constraint. The shaded area includes all of the infinite number of possibilities that fill that space. In reality, we have discrete numbers of movies. We cannot fill one theater with a third of “Mr. Baxter” and two-thirds “Birds on Springfield.” Therefore, another constraint is that the numbers that we consider as possible solutions must be integers. Fortuitously, in this simplified example, that constraint will not matter. I must admit though, that the first time I solved the problem for myself, I forgot to include this very important constraint!
Okay! We have one more constraint to model, and then we can solve the optimization problem. We must model the constraint of FML bucks. I said that “Mr. Baxter” costs 2 FML bucks, and “The Birds on Springfield” cost 4 FML bucks. We have 12 total FML bucks to spend. We can represent this as
2x + 4y <= 12.
When we graph that constraint, we see that the area allowed is different than the first constraint. Where the two areas overlap (gray) is now the new area of possible solutions.
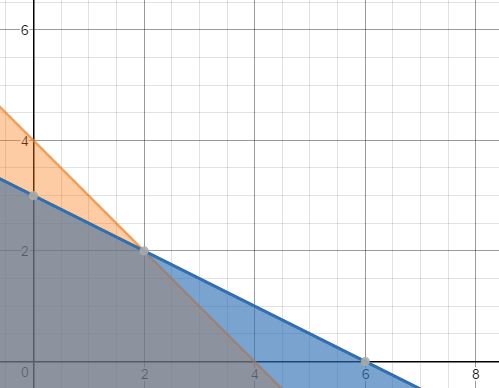
The vertices of this area are the possible solutions to the maximization problem. I’m sure there is a formal treatment of this somewhere, but this is also relatively intuitive. For instance, our constraints say that we can have anywhere between 0 and 3 “Birds on Springfield”. However, the more of the movies we have (everything else being equal), the more money we can make, so it would be foolish to choose only 2 movies or 1 movie and leave the other theaters empty.
Now that we have some possibilities, we can test those possible solutions to see which combination would make the most money. The possibilities are
y = 3, x = 0
y = 2, x = 2
y = 0, x = 4
Plugging in these values to our equation to optimize (3x + 2y), we find as results: $6 million, $10 million, or $12 million respectively. Therefore, 4 “Mr. Baxters” is the best solution.
You might have expected this result when you looked at the problem because you can see that Mr. Baxter is undervalued by the Fantasy Movie League. I expected it to bring in $3 million, which is more than the other movie, but it costs less to purchase in FML bucks.
What if we change the FML bucks cost to reflect a more realistic scenario? Now let “Mr. Baxter” cost 4 FML bucks and “The Birds on Springfield” cost 2 FML bucks. That changes our graph and the vertices of our possible solution space.
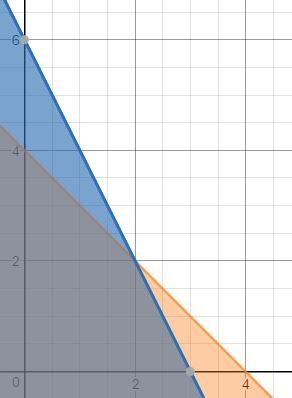
Now the possibilities are
y = 4, x = 0
y = 2, x = 2
y = 0, x = 3
Plugging these into our equation, we get: $8 million, $10 million, or $9 million respectively. Thus, now 2 of each movie is the ideal solution.
When we have 15 movies to choose from, we can’t visualize the geometry very well. Luckily for us, mathematics doesn’t care about our limited perceptual capabilities, so I can just represent the problem in the same way using a larger number of variables. The challenging part of this problem is that there are many more possible vertices to test when you have so many dimensions. Luckily, in the 1940’s, a man named George Dantzig figured out an algorithm that moves across the ideal path of vertices to the optimal solution. In our simple example, that wouldn’t save a ton of time; we might test 2 vertices instead of 3, but when you have many more vertices in multi-dimensional space, it can be very helpful. This is called the simplex method, and it is what I am using as a solver. It is already implemented in many software programs. I started with Excel, but I moved on to a script in Python.
Finally, in order to represent the $2,000,000 penalty for empty theaters, I simply represent this as a 16th movie variable, which has the expected profit of -$2,000,000. Then I change the theater constraint so that the sum of all of the movies must equal exactly 8.
So how am I doing? I’ve won every week except for one. That week, we had strikingly similar choices, which I think reveals a telling truth about the power of science and mathematics: They are most important when a solution is counter-intuitive or against the expectations of experts.