Bitcoin and traditional markets - Bitcoin price sideways but decoupled
The correlation of bitcoins with the other markets has fallen back to a minimum. The same can be said about the volatility and currently also about the performance.
For more than half a year, we've been watching Bitcoin beating compared to traditional markets. It's not about a trivial comparison of performance. Institutional investors are extremely interested in Bitcoin's claim to be a non-correlated, stable asset. As part of a guest contribution to € uro Fundresearch, BTC-ECHO addressed the question of whether Bitcoin and the highly correlated crypto market would be a good supplement to traditional portfolios. This question is for institutional investors to be interested in the crypto market, not so much for hoping for a new bull run as at the end of 2017. To clarify the suitability for traditional portfolios, an investor can look at different sizes:
- the correlation between the Bitcoin price and traditional markets
- the volatility and
- the performance of the Bitcoin course
Therefore we pay attention in this series of articles on these three sizes. They are calculated for each day based on the last 30 days. We consider the S & P 500, Nikkei and Dax indices as well as oil and gold as comparison assets from the traditional markets.
Correlation: Bitcoin is against the classic markets
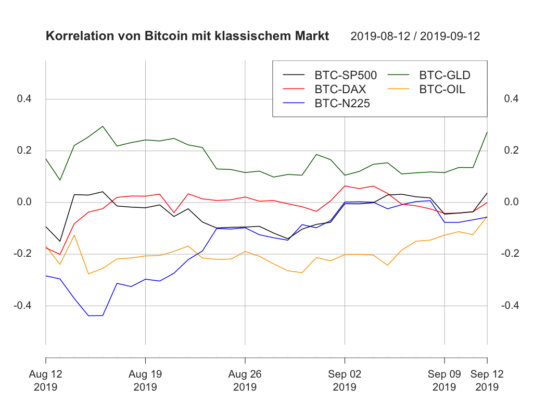
As in the previous week, it is noticeable that the Bitcoin price is developing very independently of the three indices S & P 500, DAX and Nikkei. There is a negative correlation to oil, while the coupling to gold remains positive. Regardless of Bitcoin, the strong anticorrelation between gold and the Nikkei index and a comparatively strong correlation between the DAX and oil continue to fall:
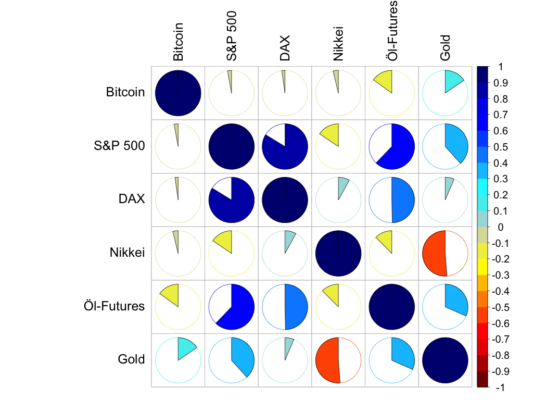
Recently, the correlation between the bitcoin price and gold has again risen above 20 percent. Similarly, bitcoin correlations with other assets have risen slightly - if you would call it the DAX, the Nikkei index and the S & P 500:
Overall, the absolute average correlation with the other markets is 8 percent. As a result, the Bitcoin price continues to be by far the least coupled to the comparative assets on the traditional market. In the Nikkei index, the second-largest relative to the absolute mean correlation, this is already 18 percent. Taking into account compensation effects, we get a similar picture: With a negative correlation to the other markets of just minus two percent, the Bitcoin price is the most independent of all assets, even taking into account offsetting effects.
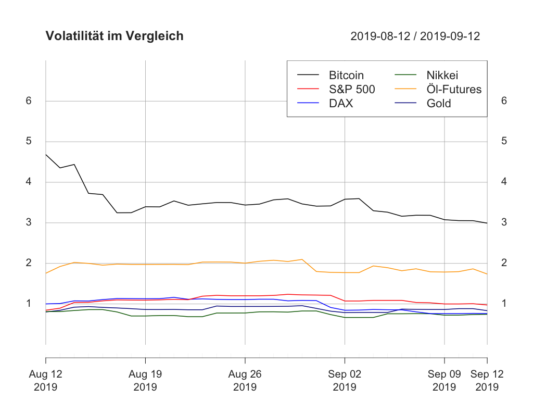
Volatilität Bitcoins in einem Plateau
Die Volatilität vom Bitcoin-Kurs konnte weiter sinken. Jüngst konnte sie sogar unter drei Prozent fallen. Das ist jedoch noch deutlich über der Volatilität der klassischen Assets, die sich bei einem bis, im Fall von Öl, zwei Prozent bewegen:
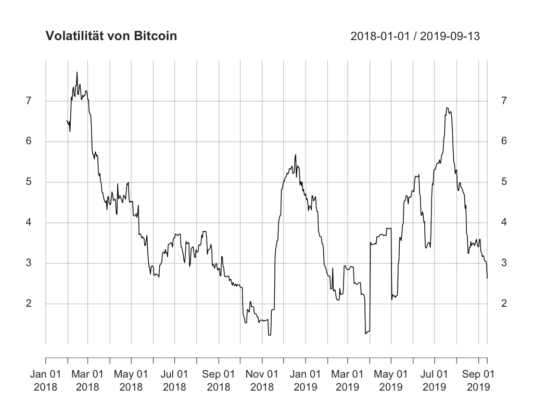
With regard to the Bitcoin price, volatility is now as low as it has been since May:
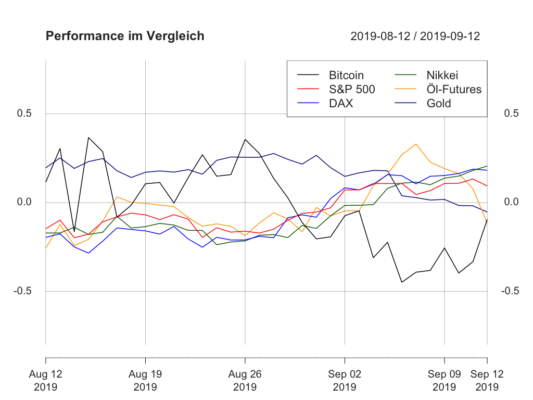
Bitcoin continues on the back seats
The low volatility and strong anti-correlation to the traditional markets will be accompanied by a negative performance as in the last weeks. This also means that Bitcoin has taken the tragic tail light in our market comparison since the beginning of December. Meanwhile, the performances of oil and gold have also fallen into negative territory. The increased performance of the Bitcoin price in the last few days raises a little hope that the performance can return to positive territory:
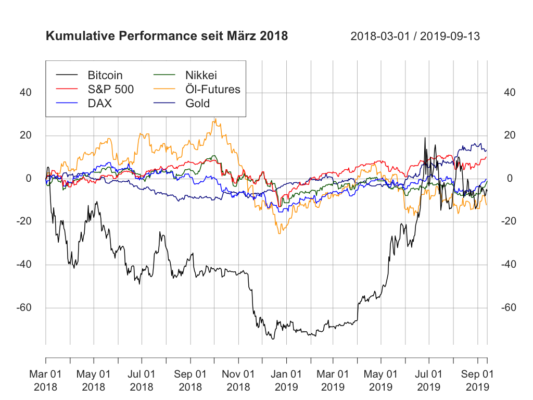
In the long run, Bitcoin is not in last place, but also in negative territory. In comparison to a hypothetical one-time investment at the beginning of March 2018, currently only oil would have done worse than Bitcoin. Compared to the previous week, the indices DAX and Nikkei were again able to position themselves via Bitcoin. Furthermore, an investor with a one-time investment in Bitcoin in March 2019 would have suffered a slight loss at the moment:
What remains to be said? Bitcoin has been moving sideways for over a month now. Without doubt, the low volatility and independence from the traditional markets are positive - even if the performance is rather negative.
But the sideways phase between September and November 2018 is hovering above the current market situation. At that time, the long sideways phase ended in a dramatic crash. A test of the moving average of the last 20 weeks is also pending. This support is currently around $ 9,500.
Congratulations @e-r-k-a-n! You have completed the following achievement on the Steem blockchain and have been rewarded with new badge(s) :
You can view your badges on your Steem Board and compare to others on the Steem Ranking
If you no longer want to receive notifications, reply to this comment with the word
STOPTo support your work, I also upvoted your post!