Understanding Modbus Ip Data Source in ScadaBr
The aim of this post is:
- Explain fields in ModbusIp DataSource
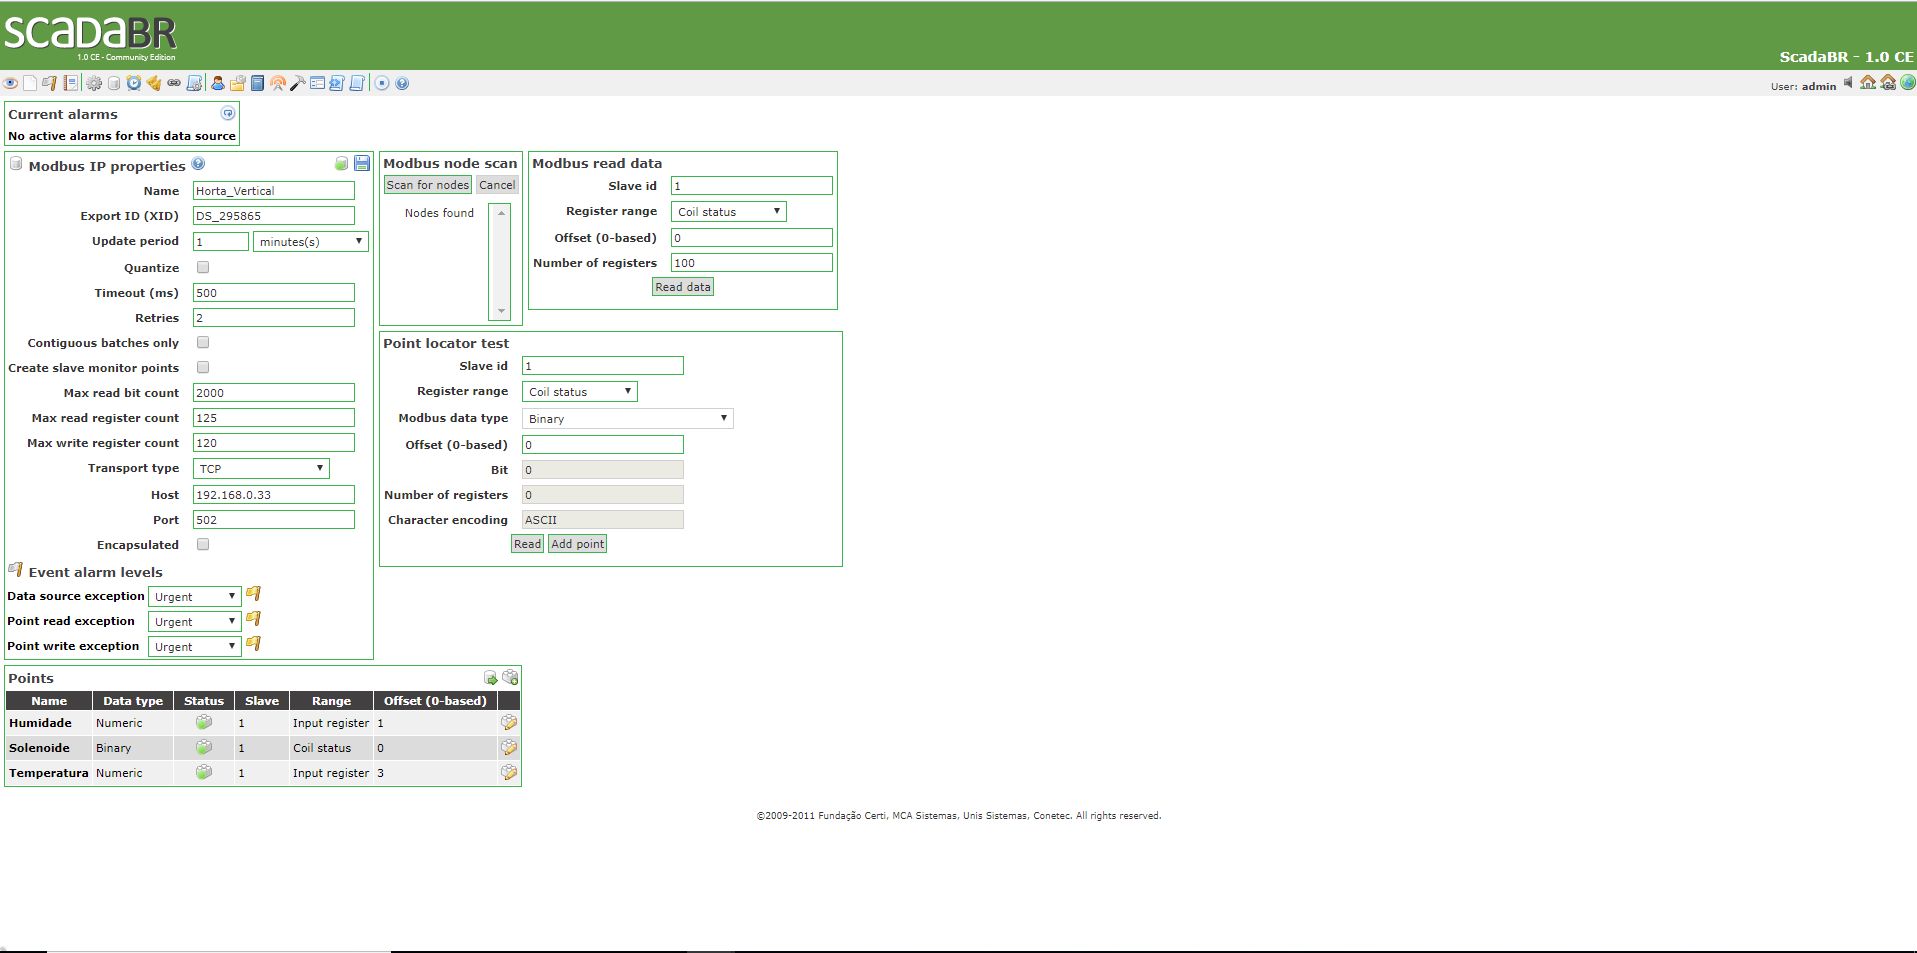
First of all, this is an image of the Modbus Data Source in ScadaBr

As shown in the image, the Modbus IP Data Source is separated in these categories:
- Modbus Ip Properties
- Event Alarm Levels
- Modbus Node Scan
- Modbus Read Data
- Point Locator test
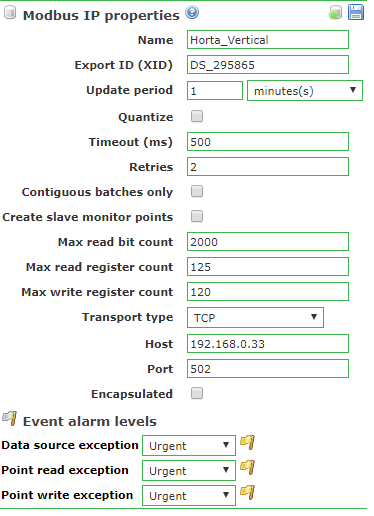
The Modbus Ip Properties are composed of the following fields:
Name --> The name of datasource, for example if we have an esp12E in the room, we can name it roomDataSource
Export Id (XID) --> unique field used by ScadaBr to identify this datasource
Update period --> the time ScadaBR will poll this data source. In case of esp12E, this is the time the ScadaBr will ask for information
Quantize
Timeout --> ScadaBr poll a datasource and this is the time ScadaBR waits for a response from the datasource.
Retries --> When a timeout occur, ScadaBR will retry the connection
Contiguous batches only --> This is for the case we will receive all data at once. In Modbus ip, we can receive one connection for each data point or receive this data all in once in one connection
Create slave monitor points --> Used for Modbus Serial
Max read bit count --> The max bits, ScadaBR accept from a datasource.
Max read register count --> The max bits a register can have. As example, a float datapoint have 2 registers.
Max write register count --> The max bits a register can have. As example, a float dataoint have 2 registers.
Transport type --> The transport type used for Esp is the TCP, ScadaBr opens and close tcp connection each time he needs to communicate. TCP keep alive is used when we want a connection to persist over the time. Udp is not used with Esp.
Host --> This is the ip device. In case of using Esp12, this is the esp ip. For example in an internal lan can be 192.168.0.12;
Port --> Defaults to 502. If we changed the default port we need to change this value.
Encapsulated
An example of configuration of an Esp 12 with an IP 192.168.0.33 with update period 1 minute.

The event alarm levels are composed of the following fields:
Data source exception -- When a connection fails, ScadaBR triggers this field.
Point read exception -- When a point read fails, ScadaBR triggers this field.
Point write exception -- When a point write fails, ScadaBR triggers this field.
Depending of the value chosen in fields (None, information, Urgent, Critical and Life safety ), the ScadaBR issue an alert which can be visualized in the alarms tab
Modbus node scan is only used for Modbus Serial.
Modbus read data tab is used for test points in your Esp12 anda returns the data in hexadecimal. The Point locator tests the points as will appear in ScadaBR
In Points, we will create the datapoints.