Running Graphs!
Run & Data & Fun!
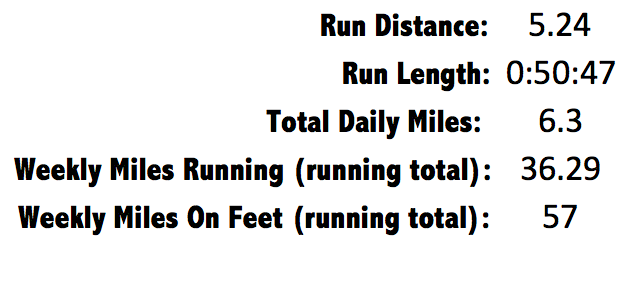
Currently on the Amtrak Northeast Corridor, heading home for the holiday weekend! I got about 5 miles in today, and forgot to click 'done' on the app, so my pace is sadly slower than it really was. This always happens- I'll be in the shower and hear my phone go 'x miles, pace y' and there's nothing you can do about it!

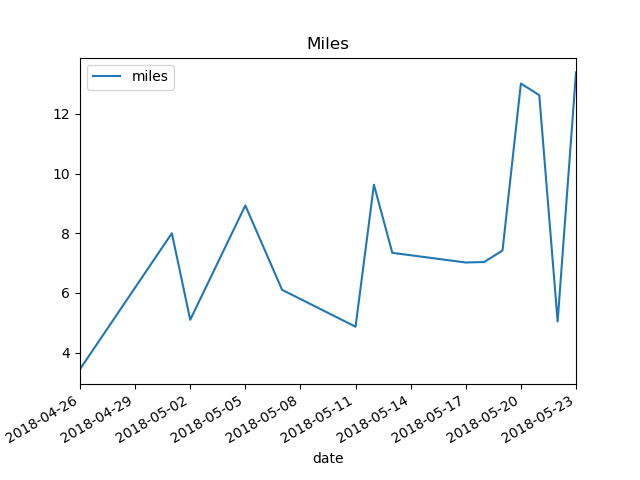
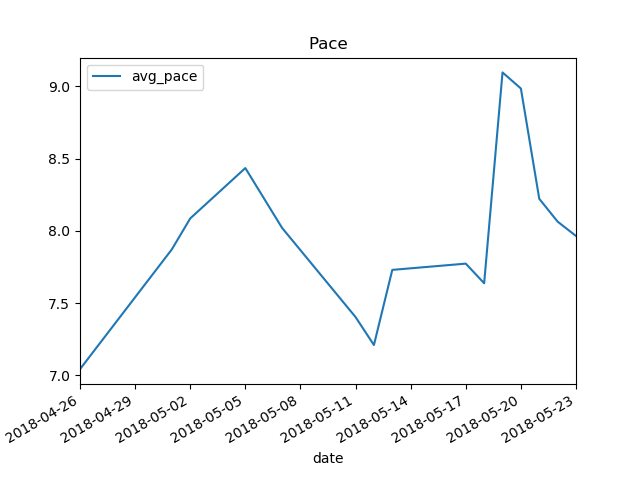
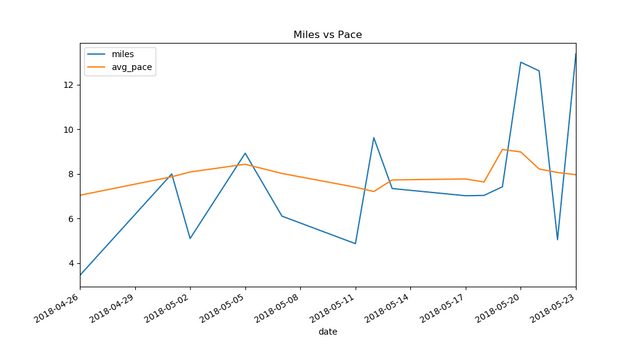
The train from Boston to NJ is about 5 hours (surprisingly, so is driving?), so I've been messing around with my running data in Python. I wrote a quick script to get my trailing 30 days miles and pace, to see how my performance is changing.

average miles: 7.931171333333333

average pace: 7.9692766666666675

So it looks like I've been averaging ~8 miles a day, with ~8 minute pace.
Hopefully I can start upping my mileage next week, and stay at around 8 minutes.
I have NO clue how to pace for a 100 mile race. To me, this will be the hardest part.
I probably won't post until after the weekend, so have fun, relax and keep running!!