Technical indicator: The RSI
👉 What does it represent?
The RSI (Relative Strenght Index) is one of the trend indicators.
The RSI calculation creates a ratio between the average of the increases and the average of the decreases and indicates the areas of overbought or oversold.
The RSI gives much better results on trading stocks than on cyclical stocks, i.e. on stocks that evolve according to the foundations of the company rather than according to market fluctuations.
👉 How to use it?
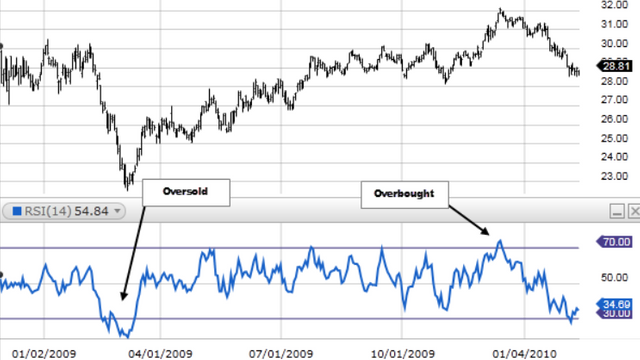
The RSI indicates a digit between 0 and 100.
An RSI 50 indicates that the market is finding a balance point on the Time Unit you are trading.
When the RSi is above 70, the market is said to be overbought and it is a candidate for a downward correction (this is a possibility, not a certainty) in your time unit
When the RSI is below 30, the market is said to be oversold and is a candidate for an upward correction (again this is a possibility, not a certainty) in your time unit.
Warning: this does not mean buying or selling systematically, RSI resistance points indicate possible reversals of the value. The divergence of levels on the RSI indicator gives strong signals of trend reversal.