How to visualize a multiple lines diagram in R
A line diagram is useful for visualizing how a certain continous variable changes in time. If you have many variables and you want to compare them then a multiple lines diagram is waht you are lookin for .. .
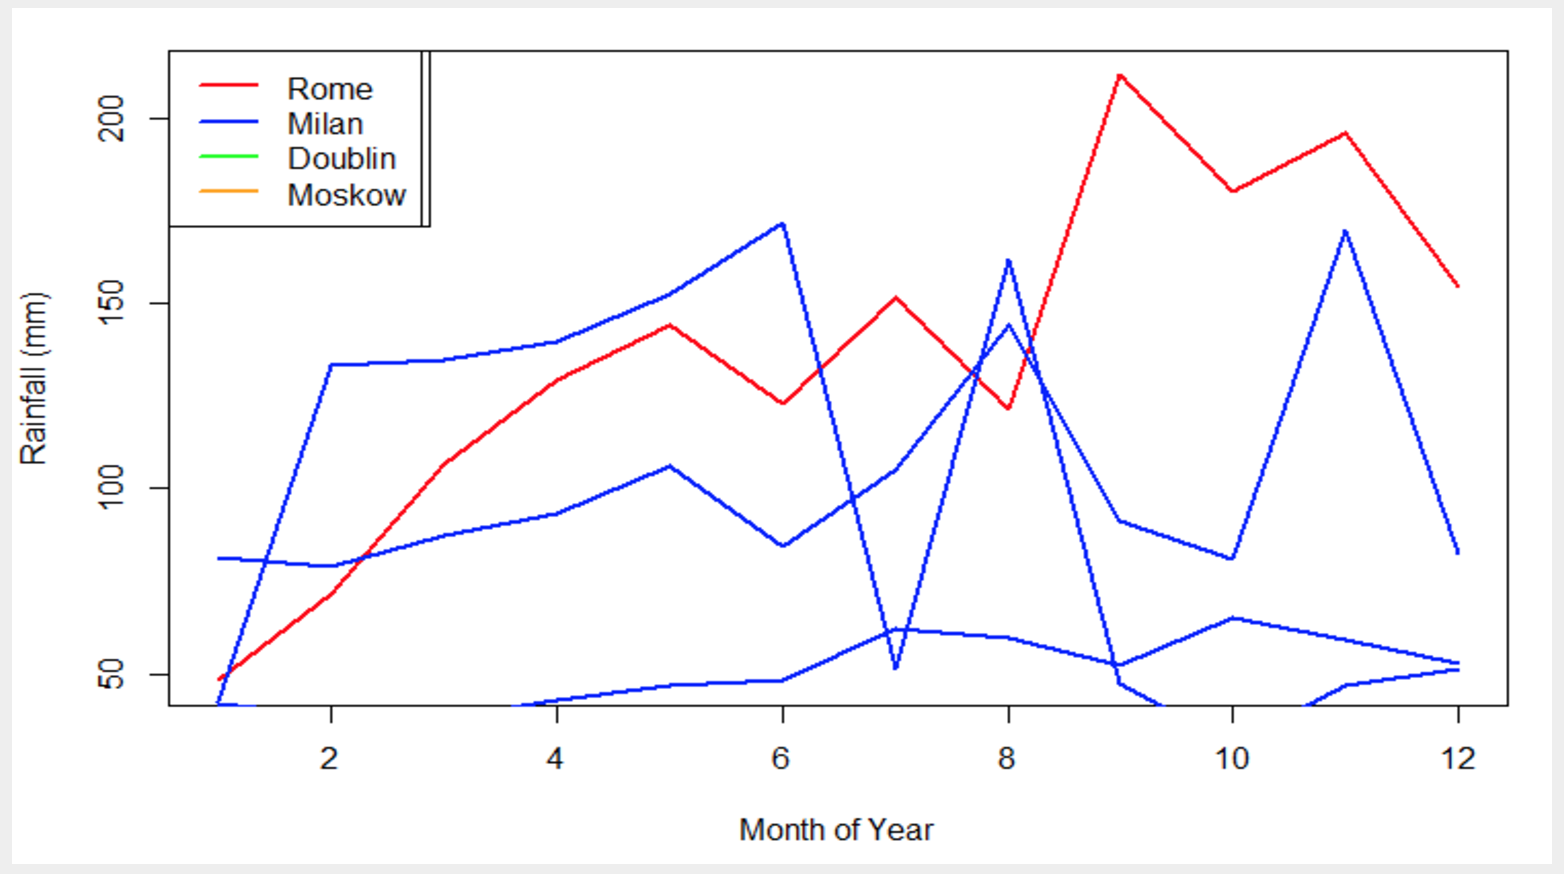
In this example of datatreemap guides on data visualization we visualize the rain falls in different cities in a certain time period
So given the dataset in which is given for every row the mm of rain fall in cities as Rome, Milan, Dublin etc.. :
Month,Rome,Milan,Dublin,Moskow

Jan,48.2,81.6,41.9,42.4

Feb,71.5,78.8,38.8,33.2

Mar,106.4,87.4,38.1,34.5

Apr,129.2,93.4,43.1,39.7

May,144,106,47,52.6

Jun,123,84.5,48.3,71.5

Jul,151.6,105,62,51.4

Aug,121.5,144.3,59.6,62

Sep,211.4,91.2,52.4,47.6

Oct,180.1,81.1,65.2,31.1

Nov,195.6,169.6,59.3,46.8

Dec,154.4,82.3,53,51.1
it is possible to visualize it following these steps that are
a) loading the data
b)plot each line in R
The code in R programming is as follows
// plot the first line that of Rome The result is displayed in the following picture : As you can see from the graphic there is how vary each rain variable in different cities. The data is clearly invented and just for this example . You can use your own dataset . With R is that easy. And if you liked this article guide on multiple lines graph in R please share
// load data
rain = read.csv("rain.csv",header=TRUE)
plot(rain$Tokyo,type="l",col="red",
ylim=c(0,300),
main="Monthly Rainfall in major cities",
xlab="Month of Year",
ylab="Rainfall (mm)",
lwd=2)
// then plot the other lines doe Milan Dublin and Moskow
lines(rain$Milan,type="l",col="blue",lwd=2)
lines(rain$Dublin,type="l",col="blue",lwd=2)
lines(rain$Moskow,type="l",col="blue",lwd=2)

The line R is very usefull for me
I am waiting your next post friend
Thank you :-) I will try to post at least one article every day.
Good planning
I will support you as long as i can brother
Lets grow together in steemit
Thank you :-) I also liked your big chips bag post.
Thanks