Ripple Market Price Analysis : Bitcoin Insider
Ripple Price Analysis
Published by @manueldelv
Always read and @upvote blog post any time or day.
Http://Facebook.Com/bitcoininsder
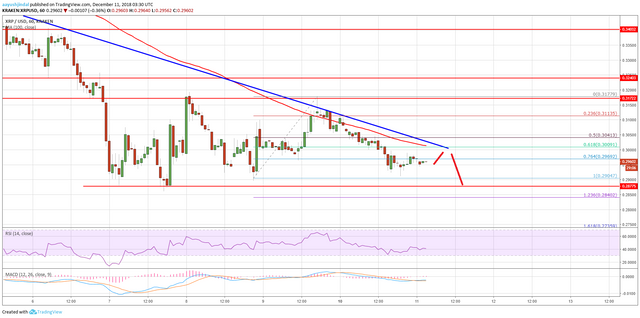
Recently, ripple price corrected above the $0.3040 and $0.3120 resistances against the US Dollar. The XRP/USD pair traded close to the $0.3180 resistance, which acted as a barrier for buyers. A short term top was formed at $0.3177 and later the price started a downside move. It declined heavily and moved below the $0.3040 and $0.3000 support levels. Sellers even pushed the price below the 76.4% Fib retracement level of the last wave from the $0.2904 low to $0.3177 high.
There was a close below $0.3000 and the 100 hourly simple moving average. The price traded close to the $0.2900 swing low. It is currently consolidating losses, with an initial resistance at $0.3000. Moreover, yesterday’s highlighted key bearish trend line is intact with resistance at $0.3000 on the hourly chart of the XRP/USD pair. Therefore, if the price corrects higher, it is likely to face sellers near $0.3000 and the 100 hourly SMA. Should there be an upside break above $0.3000, the price may correct towards $0.3040.
Looking at the chart, ripple price may extend losses below $0.2870. Sellers could push the price towards the $0.2740 level. It represents the 1.618 Fib extension level of the last wave from the $0.2904 low to $0.3177 high.
Looking at the technical indicators:
Hourly MACD – The MACD for XRP/USD is slightly placed in the bullish zone.
Hourly RSI (Relative Strength Index) – The RSI for XRP/USD is currently near the 40 level.
Major Support Level – $0.2870
Major Resistance Level – $0.3000
credits:https://www.newsbtc.com/2018/12/11/ripple-price-analysis-xrp-aims-new-weekly-low/
img credz: pixabay.com
Nice, you got a 100.0% @motochan upgoat, thanks to @manueldelv
BuildTeam wishes everyone a great Christmas and bullish Holidays
Want a boost? Minnowbooster's got your back!