Ripple (XRP) May Make A Further Dip Towards $1.00 Before Hitting Our Targets
Ripple $XRP has caught everyone's attention in the cryptocurrency markets and even those who are not trading. It's making all the headlines for the ludicrous gains it has made and believe it or not, Ripple is just getting started. If you do a quick search for Ripple Price Predictions, you will see people throwing all sorts of figures around - from $5-$10... to $25-$50 and even $100 price predictions.
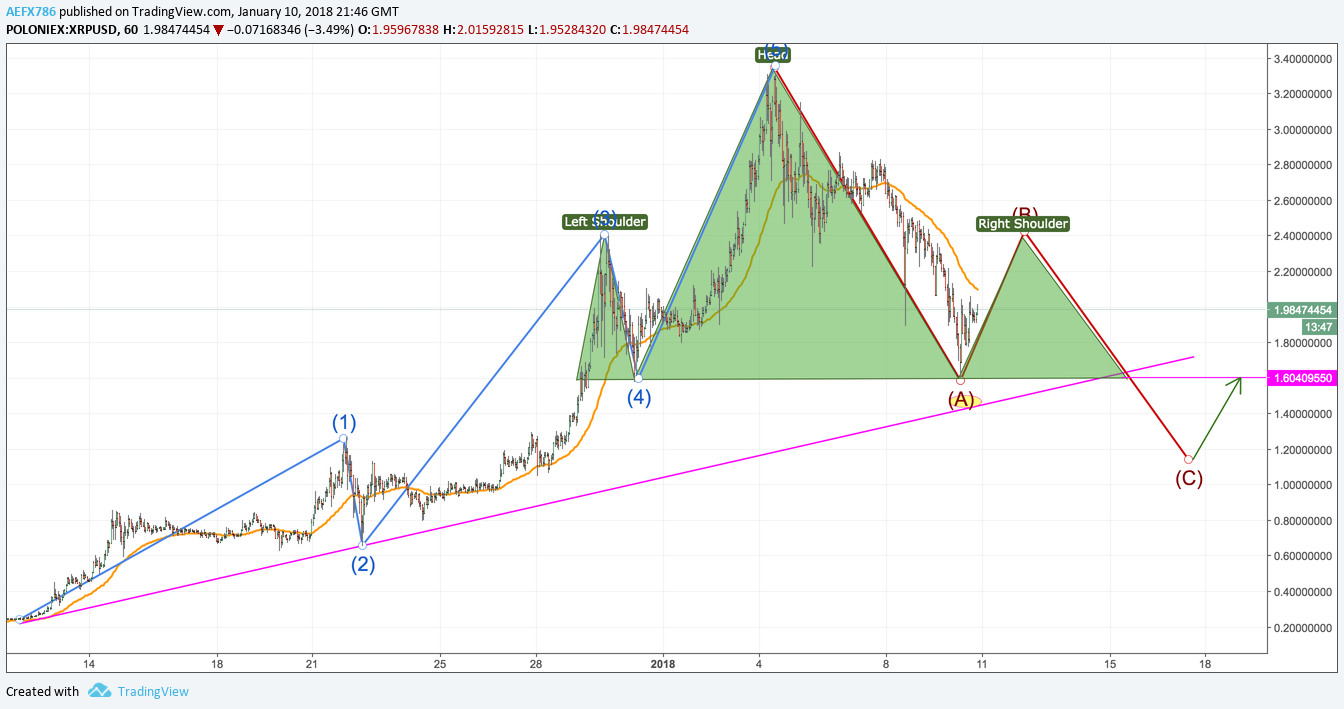
If we see the way XRP has been moving, it is typical price movements in accordance with The Elliot Wave Theory. We've seen the 1,2,3,4,5 Impulse moves and what we're seeing now is the ABC correction (see image). Completing of wave B and falling towards wave C will complete the right shoulder of a Head & Shoulders chart pattern as well. In order to complete wave C, price needs to break the neckline of the H&S pattern and from there we would expect a re-test of that neckline.
If the neckline holds as a strong resistance, this may push the price of Ripple down below $1. It is a move which nobody has expected, I personally have seen people throw $25k into Ripple from when it was at $2.60 expecting to see it shoot to $5 without any real correction.
I personally feel that Ripple has corrected and can go up from here, however, if you look at it from the Daily + Weekly timeframe, there is definitely room for this type of a deeper correction and with investors panic-selling at the moment, I would not rule it out.
I am heavily invested in Ripple and I expect by the end of 2018 Q1 we will see XRP being between $5-10 and I do feel $30 is a possibility by the end of 2018 Q4. I know a lot of people talk about market caps and it being impossible, but the same was said for Bitcoin. Everything seems impossible until it has been achieved.
I plan to publish more analysis and hope that my analysis helps in your trading careers. If there are any parts in particular you want me to analyse, please feel free to drop a comment below.
Wave C now complete and I'm expecting a pullback to $1.60-$1.70 zone to retest the neckline resistance. Also, as we've broke out from a longterm uptrend, price may retest that rising trendline as resistance. From there we may see a push down closer to or even dip under $1.00 before the next higher timeframe impulse leg.
We had our dip below $1.00 and price is currently back retesting the neckline as we expected. With support at the $1.50 level and the 4-Hour 50ema adding resistance, price is being compressed into a wedge - therefore a breakout is imminent.