Technical Charting (Lesson-1)
Friends, I want to share a very important indicator with you today, which is very important for the beginners to understand. Candlestick Charting was discovered in Japan, compared to all other curiosity, the use of candlestick charts is good and simple.
Various signals are obtained using the combination of a Candle or a lot of Candle The candlestick charts present very well in front of us in the market. By using candlestick regularly you will not be able to attract any other charts.
It may also indicate the speed or slowdown that is coming from the composition that is being produced at various levels. We have tried to briefly discuss this topic here, using two or more Candle, whether the current improvement or subtraction will move forward. It is possible that the type of candlestick type is included in the mostly vivacious software.
Candlestick has three major departments.
Real body:
Body up:
Lower body:
1. Real Body -
- The middle part of candlestick is called the real body
- The size of the Real body is dependent on the salutation of every day.
- Compared to the first day, the second day, with the increase or decrease of the price, if the price is tied, then there is the composition of the small candle
- White, gray, or blue color is used for the direction of most of the direction of improvement, black or red for subtraction is it's personal choice.
- If the price is not equal in the sense of equal amount, or if the candle is ready on the other side of the previous day itself, then the candle which is ready is called Doji.
Upper Shadow up
It is meant to be prepared in the direction of the real body, which shows the highest value of the day.
Lower shadow
It is the line at the bottom of the real body, which shows the exact meaning of the day.
Types of candles:-
Now we try to understand the different types of single candles
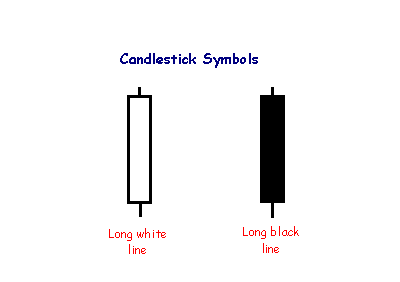
Long day candle
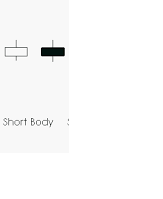
Short day candle
Long day candle - There is a difference in the closed price compared to the previous day, it can be said to be seen in the candle, it is long in the composition.
Short day candle-
The price closes with very little difference compared to the previous day on this day, which is clearly visible from the candle, it has a very small candle.
Friends will try my best to make sure that there are new people who do not have the exact names of charts, they can be understood in very easy way, so that you will remember all my posts and understand that we will gradually share the next lease
that's it for today
FOLLOW: https://steemit.com/@aashusood
Tag mmsc
UPVOTE
RESTEEM


Hi i need this post i want to learn about charts . i am waiting your next post . thanks a lot for sharing this post .