$QORA/BTC Technical Analysis Dec. 14, 2016.
Hello Steemers!

Decided to do a chart on Qora.
At the moment it is ranked 99 on coinmarketcap.
Qora has been out there for a long time and has gained some good volume at start of 2016 which makes it n interesting market for me. It has undergone a pump and seems to be on interesting levels now.
A bit more information on Qora can be found on their website and their BCT thread:
Website - http://www.qora.org/
BCT thread - https://bitcointalk.org/index.php?topic=1015379.0
As usual I will start off with clean charts and putting lines and fibs on them as go on.
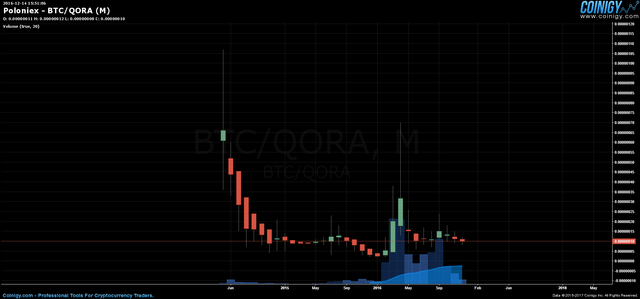
1 month chart Poloniex -clean - Dec. 14, 2016
After hard downtrend we can see how in January this year the price has touched 2 satoshi and marked an all time low with it.
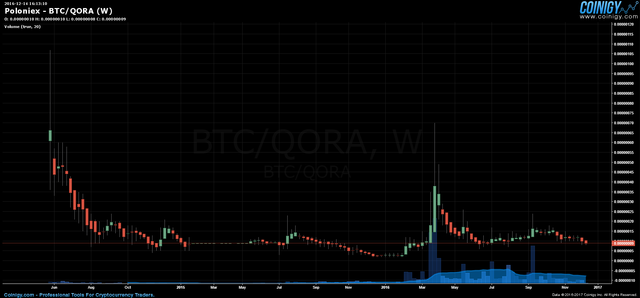
1 week chart Poloniex -clean - Dec. 14, 2016
Shortly after it started going up with allot of volume and made a new local high at 70 satoshi in April and started retracing down hard after it.
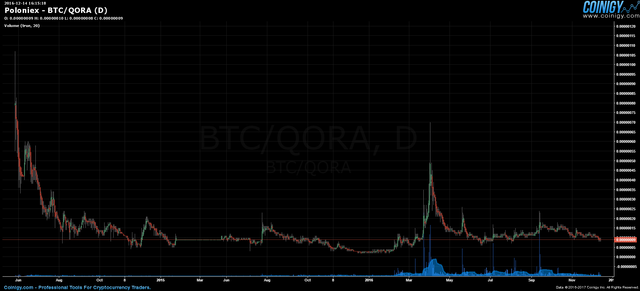
1 day chart Poloniex -clean - Dec. 14, 2016
After reaching a new local low of 11 satoshi in May it made a pump reaching to 26 satoshi, after which it got pulled back down further into making a lower local low on 6 satoshi.
After touching the 6 satoshi line it started and slow uptrend with 2 spikes along the way, first one spiking up to 17 satoshi, followed by higher local low of 7 satoshi after which came a spike to 24 satoshi.
After the last spike it got pulled back down and has been in a slight downtrend, at the moment trading at around 9-10 satoshi levels, right above a support line.
Moving on to add some lines to the charts.
Marked the lines first on the weekly, then added some more as i zoomed in into the daily.
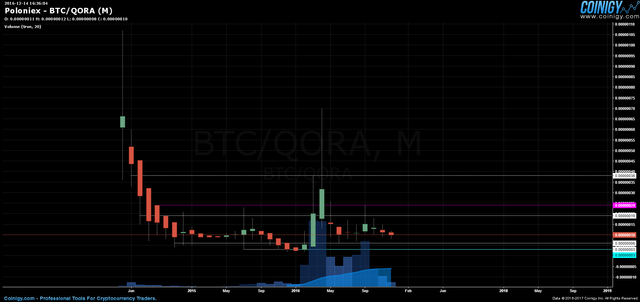
1 month chart Poloniex -lines - Dec. 14, 2016
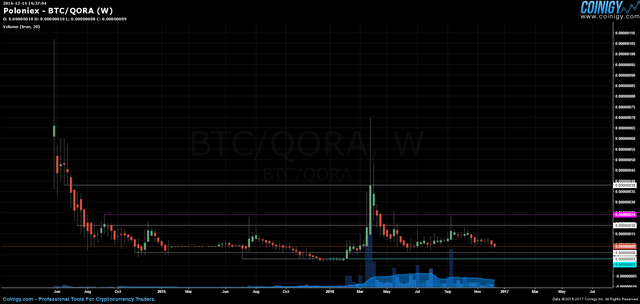
1 week chart Poloniex -lines - Dec. 14, 2016
After adding the lines it seem's the price has a major accumulation zone to around 19-20 satoshi, with tops reaching slight above it, around 25 satoshi.
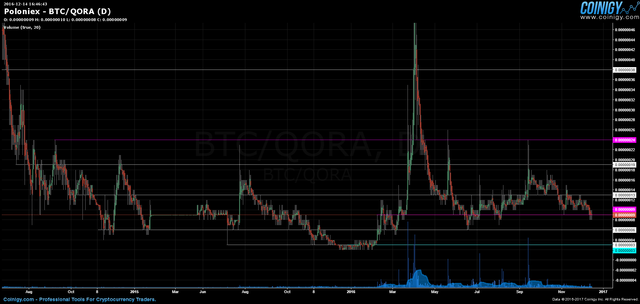
1 day chart Poloniex -lines - Dec. 14, 2016
On top of the lines I put on the weekly chart, I added the 13 and the 9 satoshi lines on the daily chart, which seem to mark a what I would call "thick trading zone".
And finally pulling up a fibonacci.
Same as for the lines, I did a separated fib for the daily chart.

1 month chart Poloniex -fib - Dec. 14, 2016
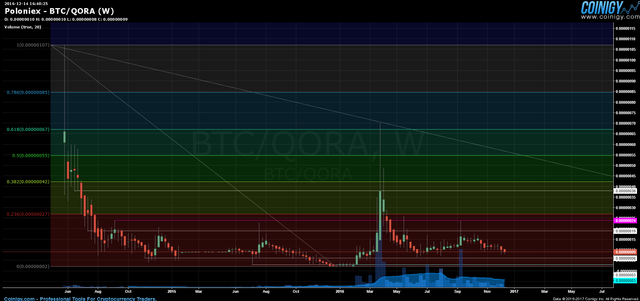
1 week chart Poloniex -fib - Dec. 14, 2016
The fib shows me once more that the major accumulation area probably has it's top around 25 satoshi.
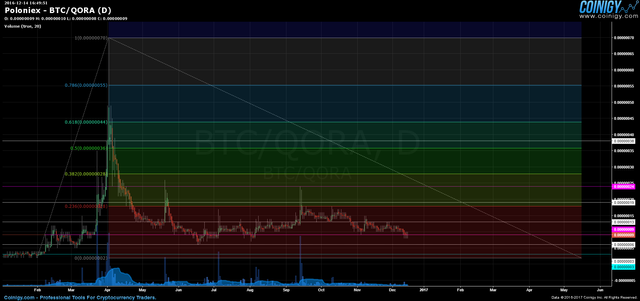
1 day chart Poloniex -fib - Dec. 14, 2016
On the daily I put the fib just for the last pump, we have retraced and entered the accumulation area before the pump, which is to around 18 satoshi.
What to expect next?
In the last few days QORA touched the 8 satoshi price which would indicate that it made a higher low in comparison to the 7 satoshi in August and the 6 satoshi in June, which is a bullish sign.
On the other hand if we look at the high's it was making after the pump, first the 26 satoshi at the end of May, then 24 satoshi in mid of September, which resulted in a lower local high, we can see that there are also bearish signs present.
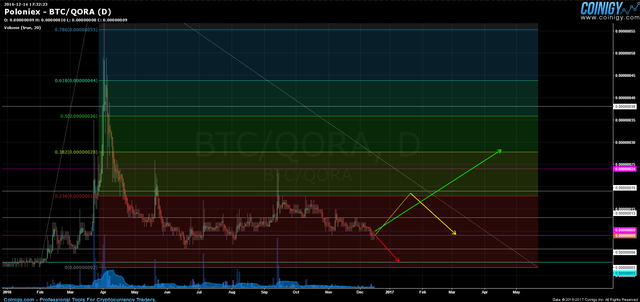
In my opinion there are 2 possible situations:
1st(green) - the price confirms the higher local low of 8 satoshi and goes up and starts making new higher local highs and higher local lows.
2nd(yellow) - the price confirms the higher low of 9 and makes a bounce to about 20 satoshi, which would mark a lower local high and continues downwards, to either make a new higher low at 9 satoshi, or for a total retrace, to 3 satoshi marking a higher local low on the big scale
3rd(red) - the price breaks the newly made higher local low and goes down first to 6 satoshi then to do a full retrace to 3 satoshi to mark a higher local low on the big scale.
COMMENT
Once again, I will post the comment by commenting as it involves my personal opinion!
Thank you for understanding!
If anyone has any questions or need's help fell free to ask, I will try to explain as fast and as best as I can.
Critics, comments, reply's, counters, advice's, etc. are always welcome!
Have my charts helped you in any way?Let me know with a comment below :)
Are there more people who are doing TA?
Please post the links to your TA's posts into the comments as well!
DISCLAIMER
I am showing multiple scenarios on the price movement, in the post itself I do not take any stance, either bullish or bearish. I am not responsible for neither you’re winning nor you're losses upon trading! the "comment" section is my personal opinion and does not mean I have to or do hold any positions in the given market.
Everyone who uses TA develops his own unique charting style, please keep that in mind.
Kind Regards, OZ :)
COMMENT
In my opinion the price is about to go the yellow route, with the total retrace, meaning I think It will pump to about 20 then start going back down till it reaches the 3 satoshi.
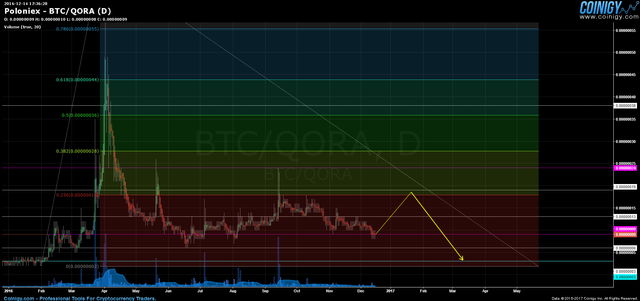
3 satoshi would be the lowest point in my view as it is just 1 satoshi higher then the all time low
Shared on twitter
Thank you! aaand i Followed since i didn't yet ;)!
Disclaimer: I am just a bot trying to be helpful.
Thanks again for the charts, data and info. Namaste :)
Amazing as always! You should start doing in depth training classes ;)