QFL Previous Trade Spotlight - 1.13.2018-TRXETH - Analysis
Disclaimer: This is not advice, this is just information that can be consumed and used however you may wish - but it is not advice or guidance.
What pairing was traded? TRXETH
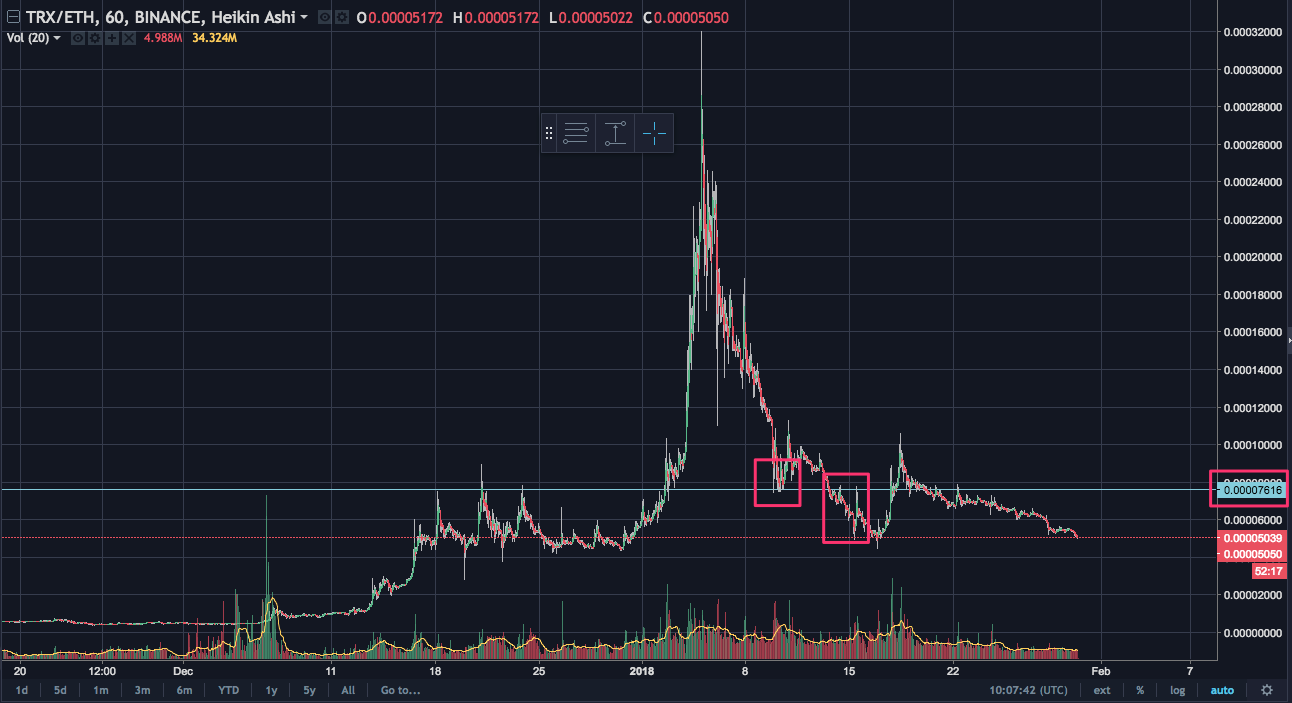
- What was the base? 0.00007616
- Was it respected? Yes
- What was the date/time of the base? 1/10/2018 13:00
- What was the date/time of the crack of the base? 1/13/2018 5:00
- What was the time elapsed between the time of the base and the time of the crack? 64 hours
- What was the crack % 35.06%
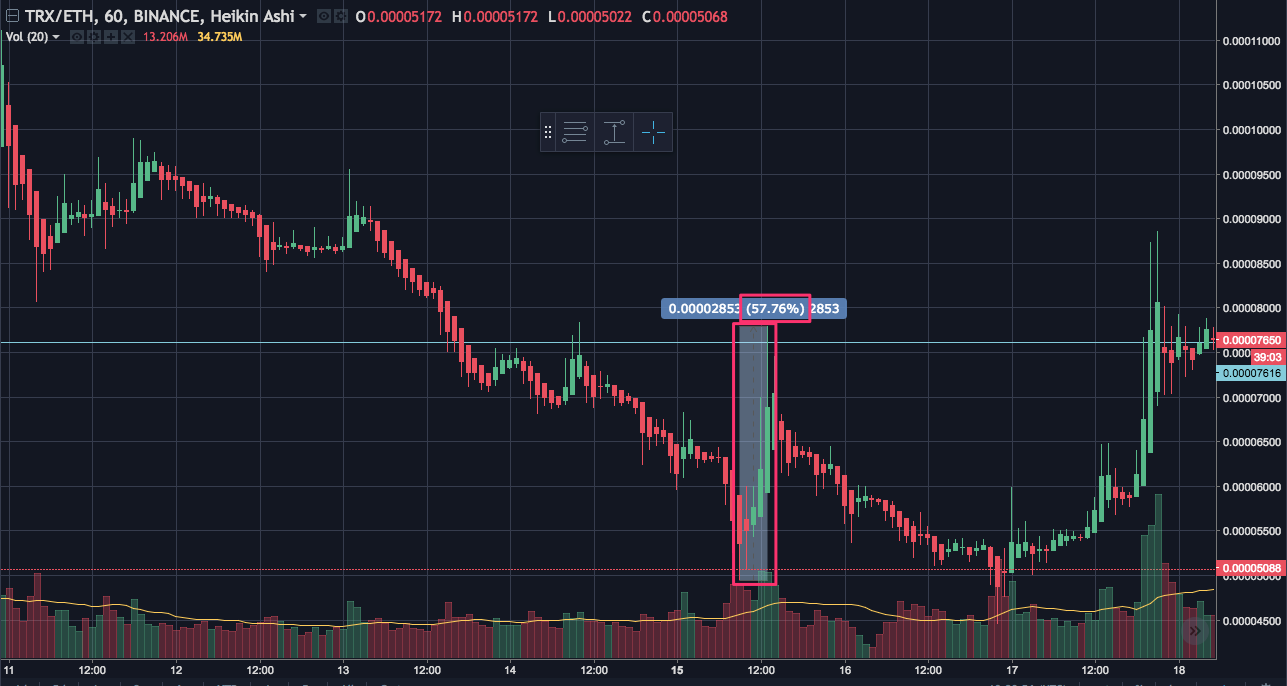
- What was the low of the crack to the high of the bounce %? 57.76%
- What is the potential opportunity for profit? 57.76%
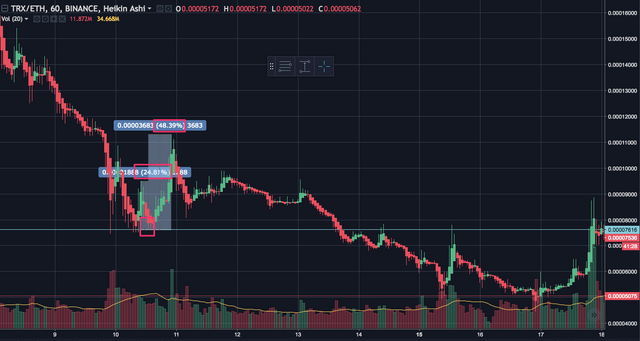
How did we determine the base? We see a 24.81% drop and 48.39% bounce - this is a price support (at least 10% drop and 20% bounce):
Where does the crack occur?
Where does the bottom of the crack occur?
Where does the bounce occur?
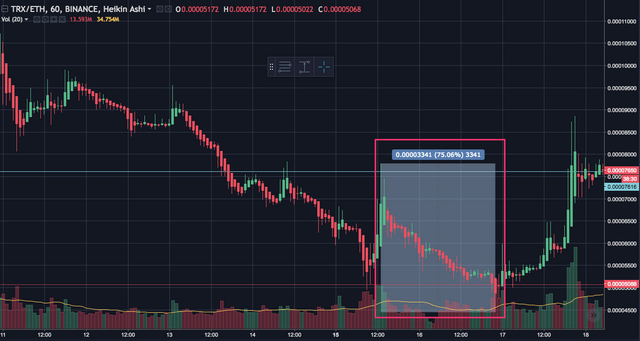
Why doesn't the rest of the (down and bigger bounce) count towards our data?
Its because this additional drop is bigger than 10%, so the next base would reset at the bottom of it. See the 75.06% drop? We need to reset the base to the bottom of this next drop. So you would have sold already and not have used this next base.
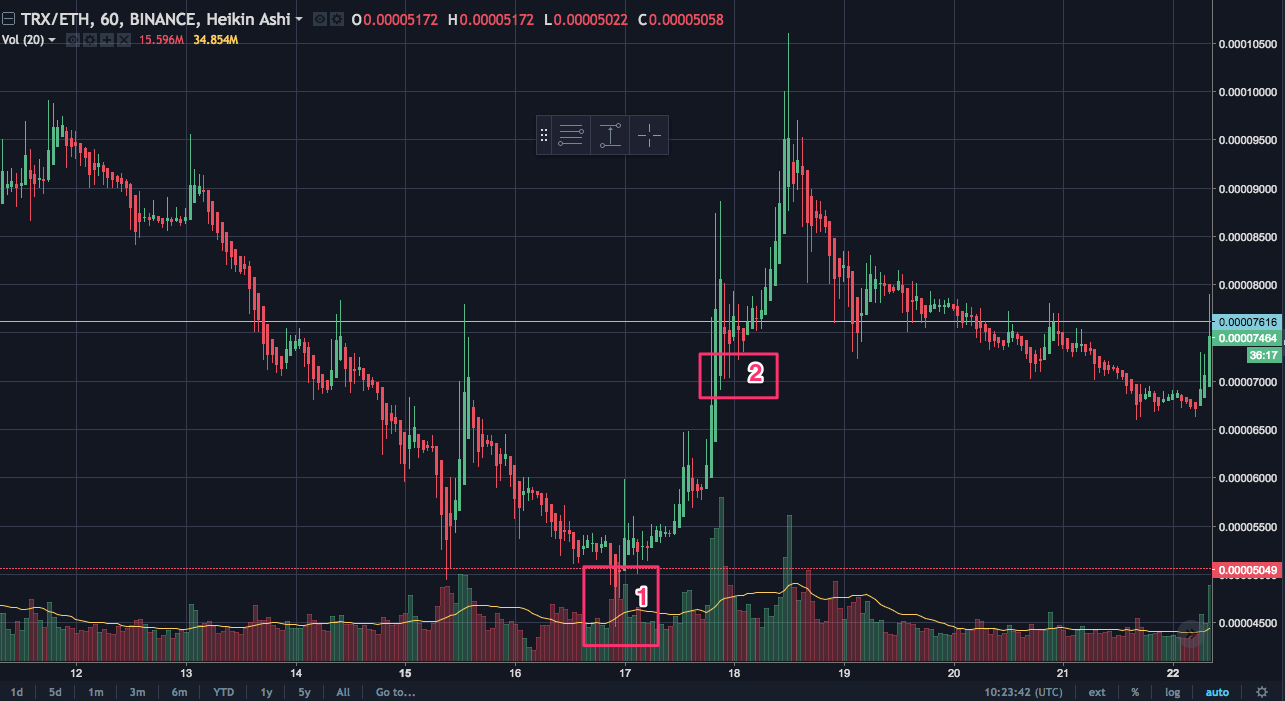
So where do the next base(s) occur and why?
So every time there is a 10% drop and 20% bounce - it becomes the next most recent base. So (1) is the base after the previous trade, but (2) ends up being the next most recent base that we will use moving forward for our next trade. See image below:
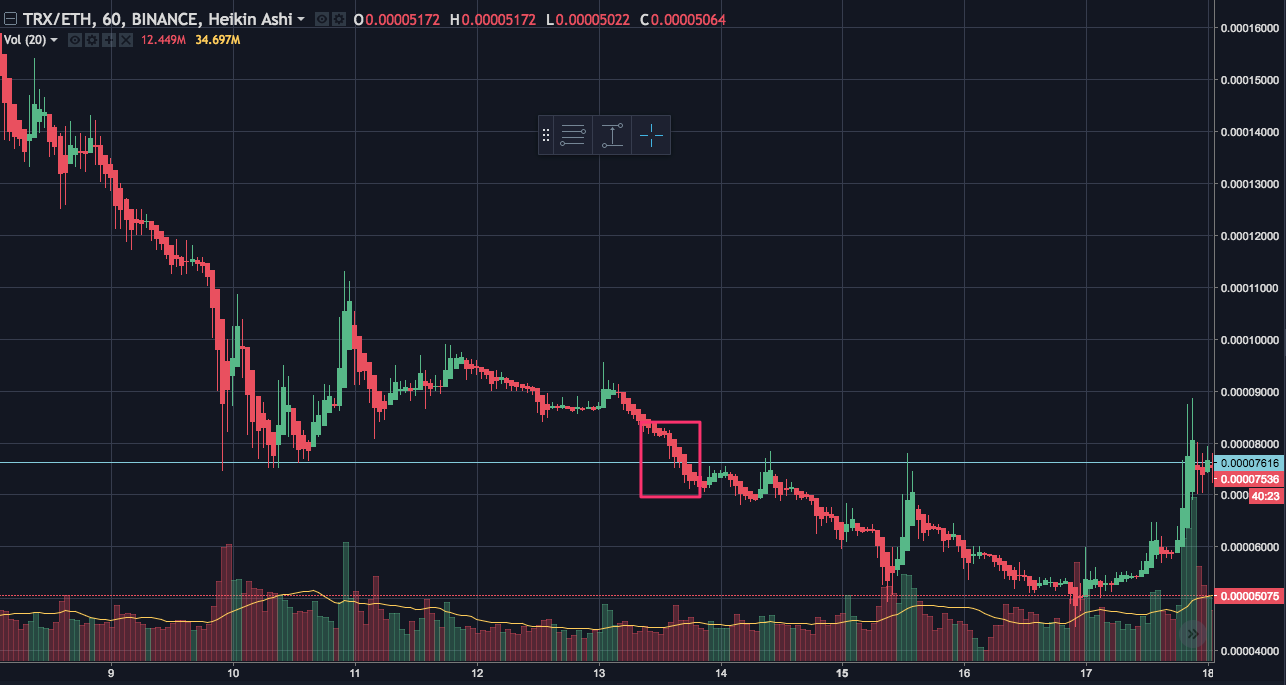
See this image to see the most recent base analysis with price range tool to show 10% drop 20% bounce:
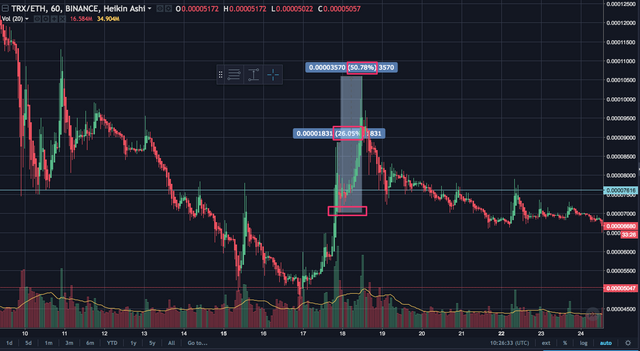
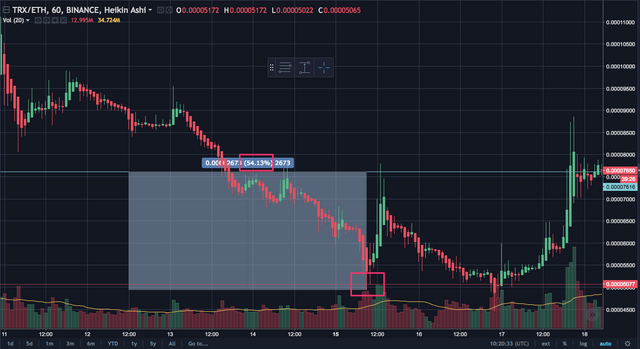
So now we move our base down to there from our previous base:
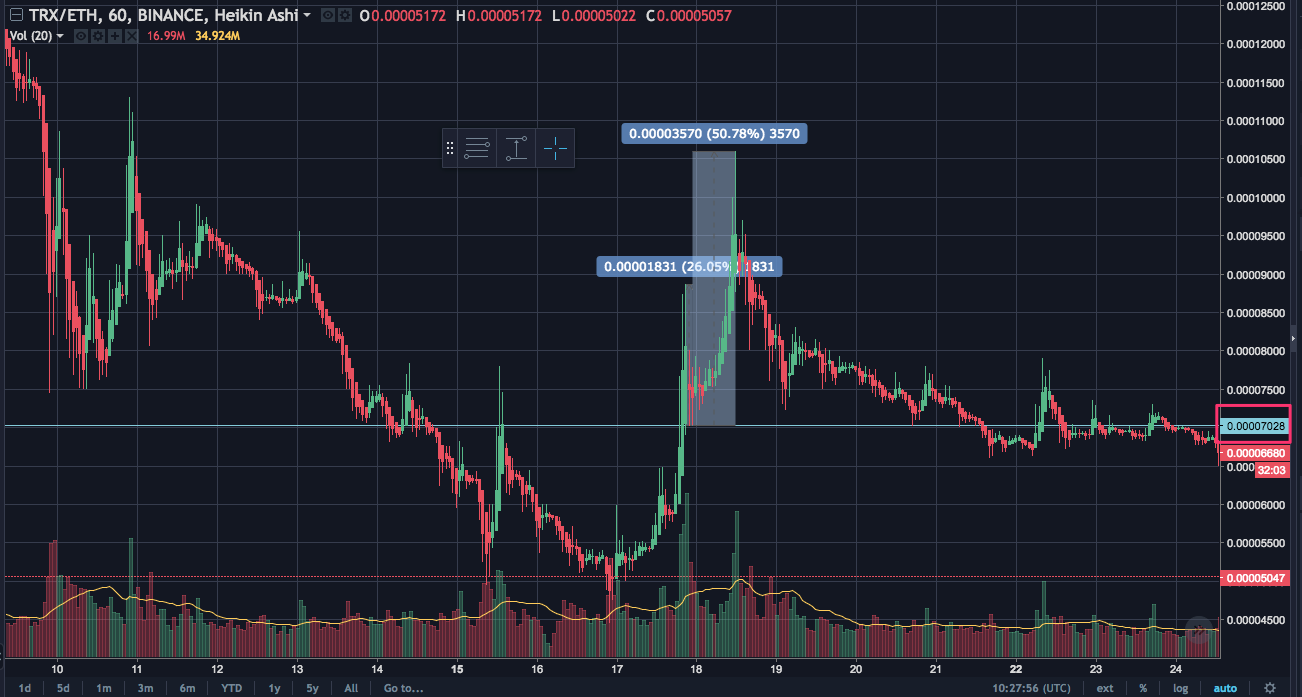
Finally, we set a new alert 7% below this base (.93*0.00007028=0.0000653604).
Now we are ready to monitor the new (7% below base) and are prepared for another trade once it is cracking that price point.
Hey baseline, did you say you had a tool to locate the base with a 10% drop and a 20% bounce? or are you just grinding over the charts all day long? If you do have a tool can you share it with us here thanks ...a QFL follower and believer...Great work on the charts and explanation much appreciated
Hey Hankster. No tool yet...qft.hodloo is the best we have for now - I'm not sure how good his algorithm is but it is as close to my bases as there is - so far!