Graphing in Python [NetworkX, Graphs in Python]
The theory of graphs also called the graph of graphs, is a field of mathematics and computer science, which studies the properties of graphs structures that consist of two parts the set of vertices, nodes or points; And the set of edges, lines or sides.
Among the applications or importance of graphs is the power to efficiently order algorithms the path of the shortest path from one point to another passing through a few or many other vertices (points)
These algorithms are used in economics, in game theory to make decisions, in programming (when we program according to how much memory we have to reserve) since we need to make a decision in wired networks and wire rods in telephony so as not to waste resources ( Antennas of all kinds) among many other applications.
for more information:
Https://es.wikipedia.org/wiki/Teor%C3%AD_de_grafos
A quote or deduction on my part is that while searching the net for some interesting applications that we will see later and python + graphs is that most of the articles are from Brazil and are in Portuguese, which gave me to understand that in Brazil Are putting hand to the theory of graphs and not surprising that its great economic impulse (to move from being a country like underdeveloped or developing Venezuela) to being a power has to do much with the application of graph theory.
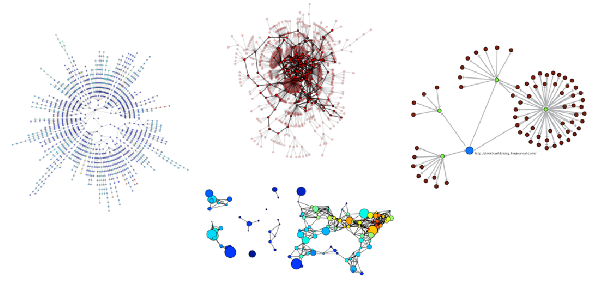
NetworkX is a package or library for Python for the creation, manipulation and study of structures, dynamics and functions of complex networks ... Because if you guessed a network of people type Facebook is also a graph and very very complicated.
NetworkX is designed to be able to help the study of social dynamics, biology and network design ... is easy to use and rapid development as we will see in this series.
NetworkX is based entirely on Python so we can model our algorithms in a more intuitive way with immediate results, for something Google in your browser uses graphs.
Installing on Debian or Ubuntu
I installed it on Knoppix.
apt-get install python-networkx
When installing this will be installed
python-matplotlib python-matplotlib-data
Which are necessary packages for the images of our graphs !!! We see a little practice but I will not explain the code so far I'll leave it for another entry: S
[Code] root @ Microknoppix: / home / knoppix # python
Python 2.7.3 (default, Jan 2 2013, 16:53:07)
[GCC 4.7.2] on linux2
Type "help", "copyright", "credits" or "license" for more information.
[/Code]
Import networkx as nx
G = nx.Graph ()
G.add_edge ('a', 'b', weight = 0.1)
G.add_edge ('b', 'c', weight = 1.5)
G.add_edge ('a', 'c', weight = 1.0)
G.add_edge ('c', 'd', weight = 2.2)
Print nx.shortest_path (g, 'b', 'd')
['B C D']
Print nx.shortest_path (g, 'a', 'd', weight = True)
['A', 'c', 'd']

For the experts this is the Dijkstra's algorithm, which is to look for the shortest point between two points or vertices ... however this graph is not weighted is only an example could put more data more vertices and see the shortest paths Between a point and another On the other hand I leave this medium medium graph because it does not really do anything but it will serve us later to graph and see things better
[Code]
Root @ Microknoppix: / home / knoppix # python
Python 2.7.3 (default, Jan 2 2013, 16:53:07)
[GCC 4.7.2] on linux2
Type "help", "copyright", "credits" or "license" for more information.
[/Code]
Import networkx as nx
Import matplotlib.pyplot as plt
N = 7
G1 = nx.complete_graph (n-1)
Nx.draw_circular (G1, ax = plt.axes (.3, .01 + .25 * 2, .3, .22)))
Plt.show ()
Pyplot is the library that uses NetworkX next to python to display the graph in a png would look like this
The options of >>> nx.draw_circular (G1, ax = plt.axes (.3, .01 + .25 * 2, .3, .22))) can be modified for the size of the graph and its position In the graph.
May God bless and guide you always