DIY - Linear Forecasting Cryptocurrencies with Rolling 1 Step Forecast & Full Backtest

I have upgraded the forecasting software so that it can backtest data too. It's really a pain in the ass to work with arrays, indexes and loops, it's always a pain in the ass since all elements start from 0, but in Python the for loop is even worse because for some reason it has a [x,y) setup the last element is actually the previous one for some reason, so you can easily mess up the code.
Gotta admit I start to become quite skilled in Python, it's an easy language nontheless, and this problem persists in other languages as well, for some reason in C it is more simple, but I can't blame Python for this, it's still my favorite language.
So I have updated the software, and please if you are a programmer, take a look at it for bugs, I have tested it multiple times, so far the indexes are configured correctly, but you can never know.
Now we can backtest data on the entire dataset. Previously we only compared the Xn value to the Xn-1 + Difference to sort of see if the last value can be forecasted from the previous one.
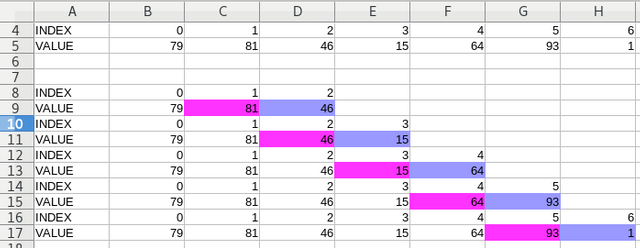
Now we loop back on all values like this for example:

So not just the last item is being tested against the forecast of itself, but the entire array is tested starting from a specified point which can be the entire series, but there must be minimum 3 elements though, so starting from element index 2.
Though if we want to use a larger sample, like if we have 1000 datapoint's it's wise to have at least a sample of 100 to estimate the difference from.
So we estimate the difference from 100 elements and then forecast the last element and looping from 101 to 1000 always forecasting the last element. This is also called the rolling step forecast, but only 1 element is forecasted.
Then we just take the average of the errors, and we will get a much clearer picture of what the real error will be, since now we forecast everything from the (total-start_position) range, thus we will have a big sample to calculate the real error margin.
Test on BTC/USD sample
So let's check the software for bugs, I hope there are none, but if you find some, please signal it, I edited the BTC/USD file leaving only the last few items:

The start_position is 3 (2nd index) by default, it returns us this data if we print out each step in the loop:
['2017-10-10 00:00:00', '4782.28']  i=   1  k=   3
(5325.130683333333, 4962.279116666666, 179.99911666666594, 0.07057211823809517)
['2017-10-10 00:00:00', '4782.28']  i=   1  k=   4
['2017-10-12 00:00:00', '5325.130683333333']  i=   2  k=   4
(5739.438733333333, 5686.555583333333, 361.4248999999995, 0.009256704694315991)
['2017-10-10 00:00:00', '4782.28']  i=   1  k=   5
['2017-10-12 00:00:00', '5325.130683333333']  i=   2  k=   5
['2017-10-14 00:00:00', '5739.438733333333']  i=   3  k=   5
(5711.205866666667, 6118.49135, 379.05261666666655, 0.06888536827043504)
['2017-10-10 00:00:00', '4782.28']  i=   1  k=   6
['2017-10-12 00:00:00', '5325.130683333333']  i=   2  k=   6
['2017-10-14 00:00:00', '5739.438733333333']  i=   3  k=   6
['2017-10-16 00:00:00', '5711.205866666667']  i=   4  k=   6
(5546.176100000001, 5988.437112500001, 277.23124583333333, 0.07672176266866443)

  LN Error:          0.05635898846787766
  Theoretical Loss:  -5.480024083550528 %
So basically k is the limit and i is the iterable variable that goes through [start_position,arraysize+1) elements or [start_position,arraysize].
So basically we calculate the average, since it’s still a linear forecasting tool (not going into deeper than that for now) and add that to the latest element. The output has 4 elements in order: real price, forecast price, difference and error.
Simply put this is how it loops though the data:

As you can see my manual calculation matches the output, as predicted. Again if you see any errors, please signal!
So if it calculates the data correctly on a small sample of 6, then let’s get the latest data from Blockchain.info and test it on that:
Although now we have to clear the 0-s from the beginning the file should start from this line 2010-08-18 00:00:00,0.074, to make it compatible with other files.

This is what we get for the latest data on a sample size of 2. Not bad, only a 5% error on the forecast, and remember this is on the entire data, we have 1309 iterations so it’s a pretty big sample, on average the error is 5%.
This doesn’t say anything about profitability though, for that you need a trade simulator which I have also made in the past, I’ll see if I can merge the two projects.
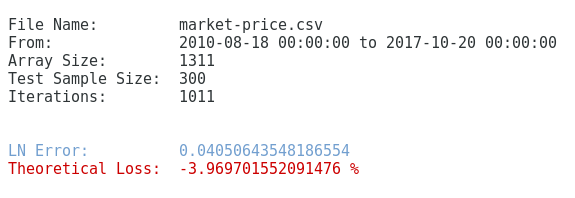
But just for linear forecasting this is a decent tool. Now let’s give it more juice and give it minimum 300 datapoints to work with.

The accuracy got immediately improved, it looks like the price does have some kind of memory, having minimum 300 datapoints to work with makes our estimation more accurate.
And remember this is not a moving average, the datapoints don’t get cut off, we simply just increase the sample of all data as we roll forward, but the previous datapoints that had less data to work with to looks like starting from 300 is better.
At least our hypothesis would be correct if it does increase with the minimum, which it doesn’t since right after we set it to 401, the accuracy drops:

So it looks like the hypothesis is not correct, perhaps maybe I should make the software as a moving average to limit it’s memory to X datapoints, since if we increase it’s memory that will give a biased output.
I will do that later, for now this is it, the software in it’s current form can be downloaded here:
DOWNLOAD CRYPTO FORECASTING TOOL 1.6
And if you find any bugs, please tell in the comments below!
Sources:
https://pixabay.com
