R's sapply() Function With Examples
Hi there. This post is about R's sapply function. The sapply function is a neat function where values in a dataframe column can be used as inputs for functions inside sapply.
The full version of this post can be found on my website here.

Examples Of sapply()
Example One
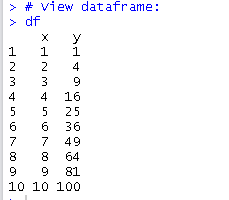
In the first example, I create a table of values for a simple quadratic function  . The x-values are natural numbers from 1 to 10 and is in a dataframe.
#### Example One:


# Create dataframe:

df <- data.frame(x = 1:10)
A R function for the quadratic equation is made which will be used for sapply() later.
# Function for x^2:

x_squared <- function(x){
  return(x^2)
}
Once the function is created, this function can be used as an argument in R's sapply function. I apply this function to the x column such that the x-values are inputs in the x_squared function.
# Change second column from xvalues to its squared values with sapply:

df$y <- sapply(df$x, x_squared)

# View dataframe:
df
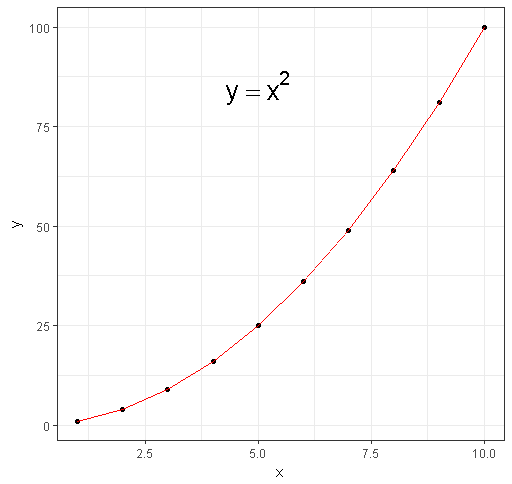
A natural extension is to use R's ggplot2 package to generate a plot and function sketch. The code below uses the library() function to import the ggplot2 package and the code block generates the plot below.
# ggplot Plot:

library(ggplot2)

ggplot(data = df, aes(x = x, y = y)) +
  geom_point() +
  geom_line(col = "red") +
  annotate("text", x = 5, y = 85, parse = TRUE, size = 7, fontface ="bold",
           label= "y == x^2") +
  theme_bw()
Example Two (Anonymous Function)
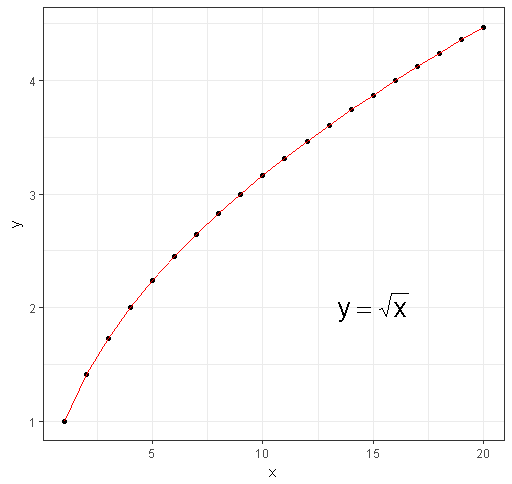
In the sapply() function, you can create a function as an argument instead of defining a function outside of sapply(). Refer to the example below where the function is the square root of x ( ).
).
#### Example Two (Anonymous Function):

df2 <- data.frame(x = 1:20)


# Change second column to its square root values with sapply and an anonymous function:

df2$y <- sapply(df2$x, function(x){sqrt(x)})

> df2
x y
1 1 1.000000
2 2 1.414214
3 3 1.732051
4 4 2.000000
5 5 2.236068
6 6 2.449490
7 7 2.645751
8 8 2.828427
9 9 3.000000
10 10 3.162278
11 11 3.316625
12 12 3.464102
13 13 3.605551
14 14 3.741657
15 15 3.872983
16 16 4.000000
17 17 4.123106
18 18 4.242641
19 19 4.358899
20 20 4.472136
Like in the first example, you can use ggplot2 for plotting.
# ggplot Plot:

ggplot(data = df2, aes(x = x, y = y)) +
  geom_point() +
  geom_line(col = "red") +
  annotate("text", x = 15, y = 2, parse = TRUE, size = 7, fontface ="bold",
           label= "y == sqrt(x)") +
  theme_bw()
Example Three
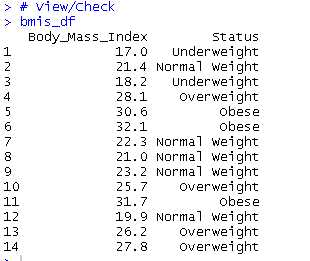
This example features assigning a weight condition given a BMI score. I have created a (fake and random) list of BMI numbers in R.
I have used this website as a reference for BMI categories.
#### Example Four (BMIs):
# Reference: https://www.nhlbi.nih.gov/health/educational/lose_wt/BMI/bmicalc.htm?source=quickfitnesssolutions

bmis <- c(17, 21.4, 18.2, 28.1, 30.6, 32.1, 22.3, 21, 23.2, 25.7, 31.7, 19.9, 26.2, 27.8)

bmis_df <- data.frame(Body_Mass_Index = bmis)


To assign weight conditions given numeric bmis, an if-elseif-else format is needed in the function for sapply().

# Assign BMI number to status condition with a function

bmi_status <- function(bmi){
  if(bmi < 18.5){
    return("Underweight")
  } else if (bmi >= 18.5 & bmi <= 24.9){
    return("Normal Weight")
  } else if (bmi >= 18.5 & bmi <= 24.9){
    return("Normal Weight")
  } else if (bmi >= 25 & bmi <= 29.9){
    return("Overweight")
  } else {
    return("Obese")
  }
}

# Using sapply to determine weight status given a BMI score in bmi column.

bmis_df$Status <- sapply(bmis_df$Body_Mass_Index, bmi_status)

# View/Check
bmis_df
@dkmathstats you were flagged by a worthless gang of trolls, so, I gave you an upvote to counteract it! Enjoy!!